

By the end of this guide, you should be able to…
-
Choose a measurement that answers a defined PEM research question.
-
State which variable is controlled, where voltage is measured and how electrical power flows.
-
Record the actual cell conditions and the evidence needed before testing.
-
Turn a raw staircase or hold into accepted, traceable data.
-
Check EIS quality before interpreting HFR or a fitted circuit.
-
Report calculations, variability and limitations without confusing them with independently measured performance.
Table of contents
-
Decision matrix: match your PEM measurement to the right ScienceGears product
-
Expert support — how ScienceGears works alongside your research
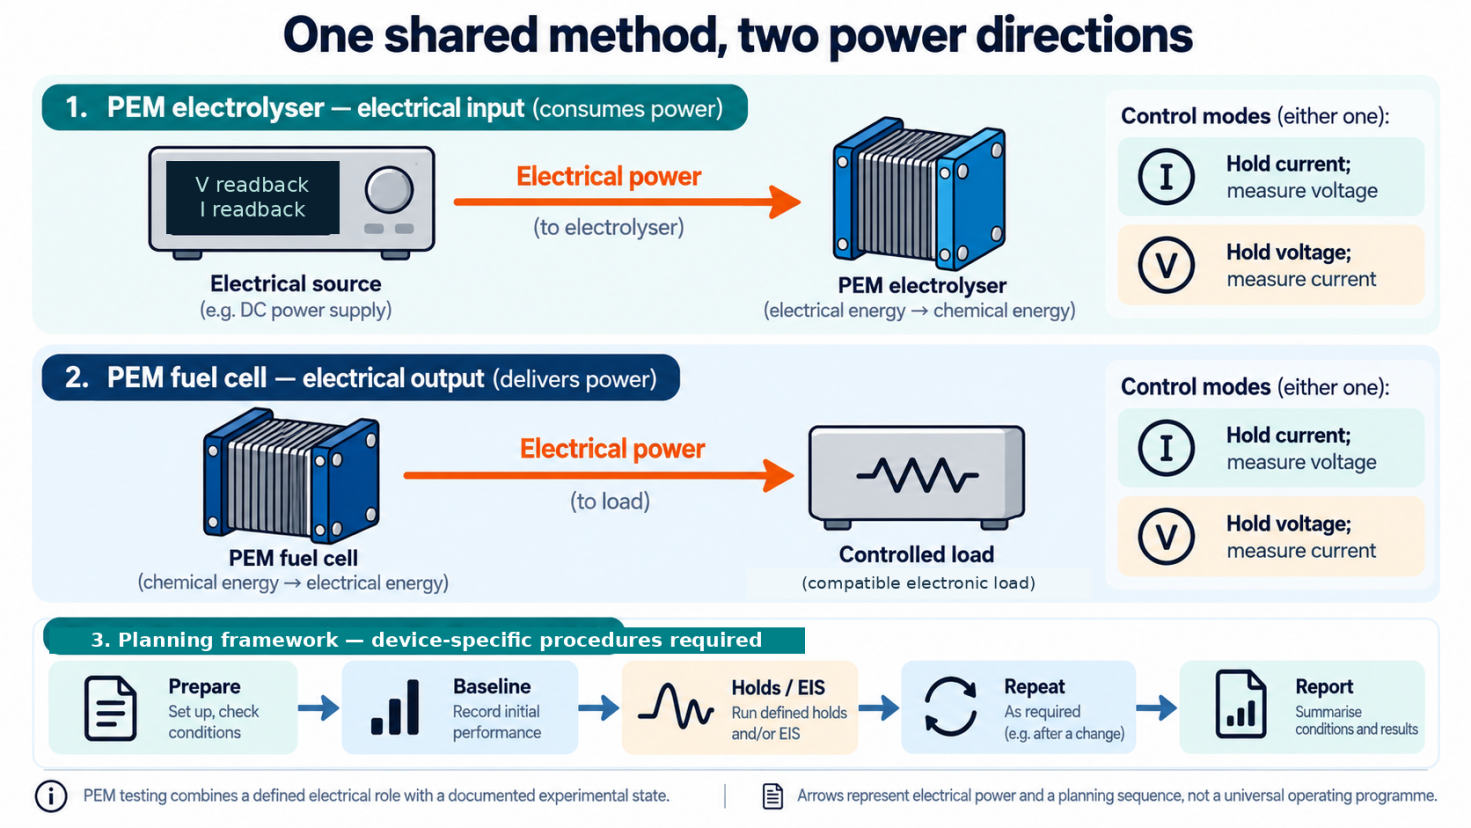
Figure 1. One shared measurement framework, two power directions. PEM testing combines the correct electrical role with a documented operating state. The source feeds the electrolyser; the generating fuel cell feeds a controlled electronic load. Current or voltage control requires a supported operating point. The planning sequence is not one universal start-up, test or shutdown programme. Device drawings are schematic, not a statement of cell count.
A smooth polarisation curve, a stable-looking current trace and a well-fitted impedance spectrum can still leave an important question unanswered: what evidence makes this a trustworthy measurement? The software may have completed its sequence while the cell temperature was changing, a current range was overloaded or an averaging window was drifting. A comparison can also look convincing when the two cells were prepared differently or their voltages were measured at different locations.
This guide connects the measurement principles to a practical research workflow. It is written for PhD students, postdocs, supervisors and technical teams in Australian and New Zealand laboratories who already have, or are specifying, a suitable PEM test setup. The aim is to turn an experimental question into a documented sequence, an accepted dataset and a conclusion that does not claim more than the experiment establishes.
Scope and safe use. The running devices are a low-temperature proton-exchange membrane water-electrolyser single cell and a PEM hydrogen–air fuel-cell single cell. The planning sequences and numerical examples are educational—not an approved operating procedure. Stacks, pressurised systems, alkaline/AEM devices and high-temperature cells need their own methods and equipment limits. Use the actual cell and instrument documentation, training, risk assessment and locally approved procedures. Hydrogen installations require appropriate engineering controls and competent operation. [18]
Terms used below: MEA means membrane electrode assembly; CA, chronoamperometry; CP, chronopotentiometry; EIS, electrochemical impedance spectroscopy; OCV, open-circuit voltage; DC and AC, direct and alternating current. Further terms are defined where they enter the experiment.
Key principle: A smooth trace is not enough: record the operating state, acceptance rule and evidence behind every reported point.
In this guide
Understand the measurement: 1. Operating modes · 2. The two PEM devices · 3. Signs and units
Prepare the experiment: 4. Configuration · 5. Sensing and acceptance checks · 6. Actual operating conditions
Build and acquire the method: 7. Method planning · 8. Accepted polarisation data · 9. CA and CP
Interpret within the evidence: 10. EIS · 11. Calculations · 12. Different diagnostic experiments
Close and report: 13. Reproducibility and reporting · 14. Common mistakes · 15. FAQs
Quick decision guide: choose the question before the technique
The following is a planning aid, not a ready-to-run method. Each choice still needs an applicable protocol, an achievable operating window and a defined response to failed checks. [1, 2, 6, 7, 9]
| Research question | Candidate measurement | Evidence to retain |
|---|---|---|
| What voltage is required or delivered at selected current densities? | Current-controlled polarisation staircase | Accepted mean measured voltage and current density, conditions and variability. |
| What current can the device sustain at a specified terminal voltage? | CA or voltage hold | Current–time record, actual voltage, environment and limit events. |
| How does voltage respond at a specified current? | CP or current hold | Voltage–time record, actual current and matched baseline comparison. |
| What is the frequency-dependent response at a defined state? | Potentiostatic or galvanostatic EIS | Raw complex impedance, DC state, acquisition settings and quality checks. |
| What is happening at one electrode, or is crossover changing? | A separate, validated diagnostic | Method-specific reference, feed, potential and analytical evidence. |
1. The four operating modes: control is not power direction
Potentiostatic operation controls a voltage or electrode potential; galvanostatic operation controls current. In this guide’s ordinary full-cell measurements, the controlled voltage is the voltage between the specified cell terminals. CA and CP describe the associated time-dependent measurements; neither name determines whether the equipment supplies or absorbs electrical power. [1, 2]
| Device and control | Held variable | Measured response | Equipment’s electrical role |
|---|---|---|---|
| PEM electrolyser, current control | Cell current | Terminal voltage versus time | Supplies power. |
| PEM electrolyser, voltage control | Terminal voltage | Current versus time | Supplies power. |
| Generating PEM fuel cell, current control | Current drawn from the cell | Terminal voltage versus time | Absorbs power as a load. |
| Generating PEM fuel cell, voltage control | Terminal voltage | Current drawn versus time | Absorbs power as a load. |
These combinations apply only when the complete configuration supports the requested point. During normal generation, holding fuel-cell voltage means adjusting the load current to reach an attainable terminal voltage—not normally forcing electrical power into the fuel cell. The cell remains the electrical source. [3, 4]
Choose current control when the comparison is defined by current density, and voltage control when the current sustained at a particular voltage is the question. One controller does not independently impose arbitrary current and voltage simultaneously. Limits on the other variable constrain operation; they do not make an unattainable point possible. [19]
Four states that must not be confused
Open-circuit observation draws no intentionally imposed external current, although small measurement-input or leakage currents can exist. The observed voltage is not necessarily zero.
A 0 V full-cell command is an active voltage-control request. On a generating cell, a capable load would attempt a short-circuit-like state, subject to its limits. It is not an instruction to disconnect.
A zero offset from recorded OCV, where the software offers that reference, means the recorded baseline voltage—not zero terminal voltage. If the cell changes afterwards, holding that recorded value is not the same as observing its new open-circuit state. Check the actual software reference. The cited software documentation illustrates this terminology; its EFM experiment is not a PEM test method. [20]
Output off or software stop has the behaviour defined by the actual instrument and station. A command of zero current, zero voltage and an output-disconnect state are not interchangeable. Confirm the documented state separately from the procedure for gas isolation, cooling, pressure management and safe disconnection. [19]
2. What happens inside the two PEM devices?
PEM water electrolysis: electricity to hydrogen
Water is split into hydrogen and oxygen. Protons move through the membrane from the oxygen-evolving side towards the hydrogen-evolving side, while the external circuit supplies the electrical energy. The half-reactions, written on a two-electron basis, are: [3, 5]
Anode, oxidation: H2O → ½O2 + 2H+ + 2e−
Cathode, reduction: 2H+ + 2e− → H2
Overall: H2O → H2 + ½O2
In normal electrolysis, the anode is positive and the cathode negative.
PEM hydrogen–air fuel cell: hydrogen to electricity
Hydrogen is supplied to the anode and an oxygen-containing stream to the cathode. Protons pass through the membrane; electrons pass through the external load. The reactions are: [4, 5]
Anode, oxidation: H2 → 2H+ + 2e−
Cathode, reduction: ½O2 + 2H+ + 2e− → H2O
Overall: H2 + ½O2 → H2O
During normal generation, the anode is negative and the cathode positive. Anode always denotes oxidation and cathode reduction; their electrical polarities are not universal.
The MEA provides the membrane/catalyst core. State whether your use of “MEA” also includes adjoining diffusion or transport layers. Flow fields, transport layers, current collectors, seals and assembly conditions contribute to the complete device being measured. A full-cell result is therefore not simply an intrinsic catalyst-activity measurement. [11]
Why 1.23 V and 1.48 V answer different questions
For the hydrogen/oxygen reaction at approximately 25 °C with liquid water at unit activity and gases on the stated standard-state basis, the reversible voltage is approximately 1.229 V. It relates to the reaction Gibbs energy. The corresponding thermoneutral voltage is approximately 1.48 V and relates to reaction enthalpy. Temperature, pressure and chemical activities change the relevant thermodynamic values. [5]
These are explanatory reference quantities, not conditioning voltages or protection limits. At useful current, irreversible losses generally raise the electrolyser’s required voltage above its reversible value and lower a generating fuel cell’s delivered voltage below its reversible value. Several losses can overlap; the difference cannot automatically be assigned to one electrode. [11]
Nor does a compatible electrical controller make the same physical cell reversible. The cell and supporting system must be designed and qualified for both environments before reverse operation is contemplated.
3. Establish signs, units and the measurement boundary
Define the full-cell voltage and signed current before processing an exported file. Here:
Vcell = Vpositive terminal − Vnegative terminal
Let Iin be positive when current enters the cell’s positive terminal. Under this passive sign convention:
Pcell = VcellIin
Positive power means electrical absorption by the cell; negative power means delivery from it. For performance graphs, define a non-negative current magnitude Imag = |Iin|. In the generating regime, define the positive output current as Iout = −Iin. These are declared conventions, not instructions to reverse every instrument’s exported signs.
With active geometric area A, the geometric current density and area-specific power magnitude are:
j = Imag/A and p = Vcellj
Amperes divided by cm² give A/cm²; volts multiplied by A/cm² give W/cm². Report the actual area definition. Geometric area is not electrochemically active surface area, and the two normalisations are not interchangeable. [11]
Illustrative comparison. An assumed 5 cm² cell at 1 A/cm² carries 5 A. At an assumed 1.90 V, the electrolyser consumes 9.50 W, or 1.90 W/cm². At an assumed 0.65 V, the fuel cell delivers 3.25 W, or 0.65 W/cm². Its signed cell power under the convention above is −3.25 W. These are calculations, not performance targets.
The voltage basis must travel with every result. Terminal voltage, working-electrode potential against a reference and voltage offset from a stored OCV are different quantities. Multiplying a reference-electrode potential by current does not establish the electrical power crossing the full-cell terminals. [11]
4. Confirm the measurement configuration before the experiment
Detailed equipment selection is a separate task. At this stage, the laboratory needs evidence that its chosen configuration supports the proposed method: the actual instrument, load or booster, software, cable arrangement, ranges and sensing points—not merely a technique name on the screen.
Confirm the required source or sink direction, current at the actual cell voltage, continuous power, low-current performance and protected-variable limits. For EIS, include the alternating perturbation around the DC point and the measurement performance of the complete setup. A configuration that supports a DC hold does not automatically support the desired impedance experiment.
Record the chosen current ranges and what happens during range changes, overloads or loss of control. Preserve measured readbacks and fault flags. A nominal setpoint is not evidence that it was achieved.
Use the manufacturer-approved verification procedure for the configured measurement chain before using a reactive cell. Published PEMWE work demonstrates that external connections and measurement arrangements can contribute to recorded impedance. Treat any integrated source/load arrangement as a documented system, not permission to connect independent controllers in parallel. [12]
The output of this stage is an acceptance record: required capability, supporting documentation, verification result and any unresolved item. It is not yet evidence that the real MEA is leak-free or electrically sound.
For higher-current work, the configured potentiostat/galvanostat system may include an appropriate current booster or load architecture; suitability must still be confirmed for the required source/sink operating window and EIS conditions.
5. Connect the measurement and separate the acceptance checks
Two electrochemical electrodes can use four leads
A full cell has two electrochemical electrodes. A four-wire, or Kelvin, arrangement uses separate current-carrying and voltage-sensing leads. The voltage belongs to the chosen sense locations, rather than being inferred at the instrument end of the high-current cables. Internal membrane, contact and electronic contributions within that boundary remain part of the measurement. [11, 12]
Separate sense leads do not create a four-electrode electrochemical experiment, remove the cell’s internal resistance or recover electrical energy dissipated in external current leads. Mark the sense points on the configuration record so that comparisons use the same boundary.
For researchers selecting compatible single-cell hardware, ScienceGears MEA test cells provide a relevant starting point for matching the cell hardware, flow-field arrangement and measurement boundary to the experiment. For acidic PEM water electrolysis, do not infer anode-side materials compatibility from the fixture name: verify all wetted plates, conductive coatings and seals against the oxygen-evolving environment and the planned operating conditions. [21]
A reference electrode provides a different measurement
In a three-electrode experiment, working-electrode potential is measured against a reference while current passes between working and counter electrodes. Introducing a reference into an operating membrane cell needs a suitable geometry and interpretation. Full-cell voltage alone does not reveal both individual electrode potentials. [11]
Use the actual manufacturer’s terminal assignments and approved grounding arrangement. Check differential input range, input-to-ground/common-mode limits and channel isolation separately; a small measured cell voltage does not establish a safe input-to-ground voltage. Labels such as WE, CE, RE, sense, high and low are not universal wiring instructions. Retain protective earth and do not move leads on an energised reactive assembly. [19]
Record three different kinds of acceptance evidence
| Check | What it establishes | What it does not establish alone |
|---|---|---|
| Instrument and measurement-chain verification | The configured control and readback chain behaves as required over the verified region. | The real MEA has no unintended conduction, leaks or gas crossover. |
| Prescribed containment and installation checks | The assembly meets its applicable containment acceptance procedure. | Electrical measurement accuracy or acceptable membrane crossover. |
| Applicable cell electrical-integrity check | The assembly passes a method appropriate to its materials, hydration and history. | Every gas-purity, durability or performance requirement. |
This separation is a planning framework. Fortiner and colleagues provide a specific electrical-short check within an ambient-pressure benchtop PEMWE procedure for cells no larger than 25 cm². That is a source to examine for an applicable setup, not a universal voltage or pass/fail threshold. [9]
Do not proceed on a suspected short or failed containment result. Follow the approved investigation procedure. An ordinary resistance reading across a hydrated or reactive cell is not a substitute for a validated integrity method.
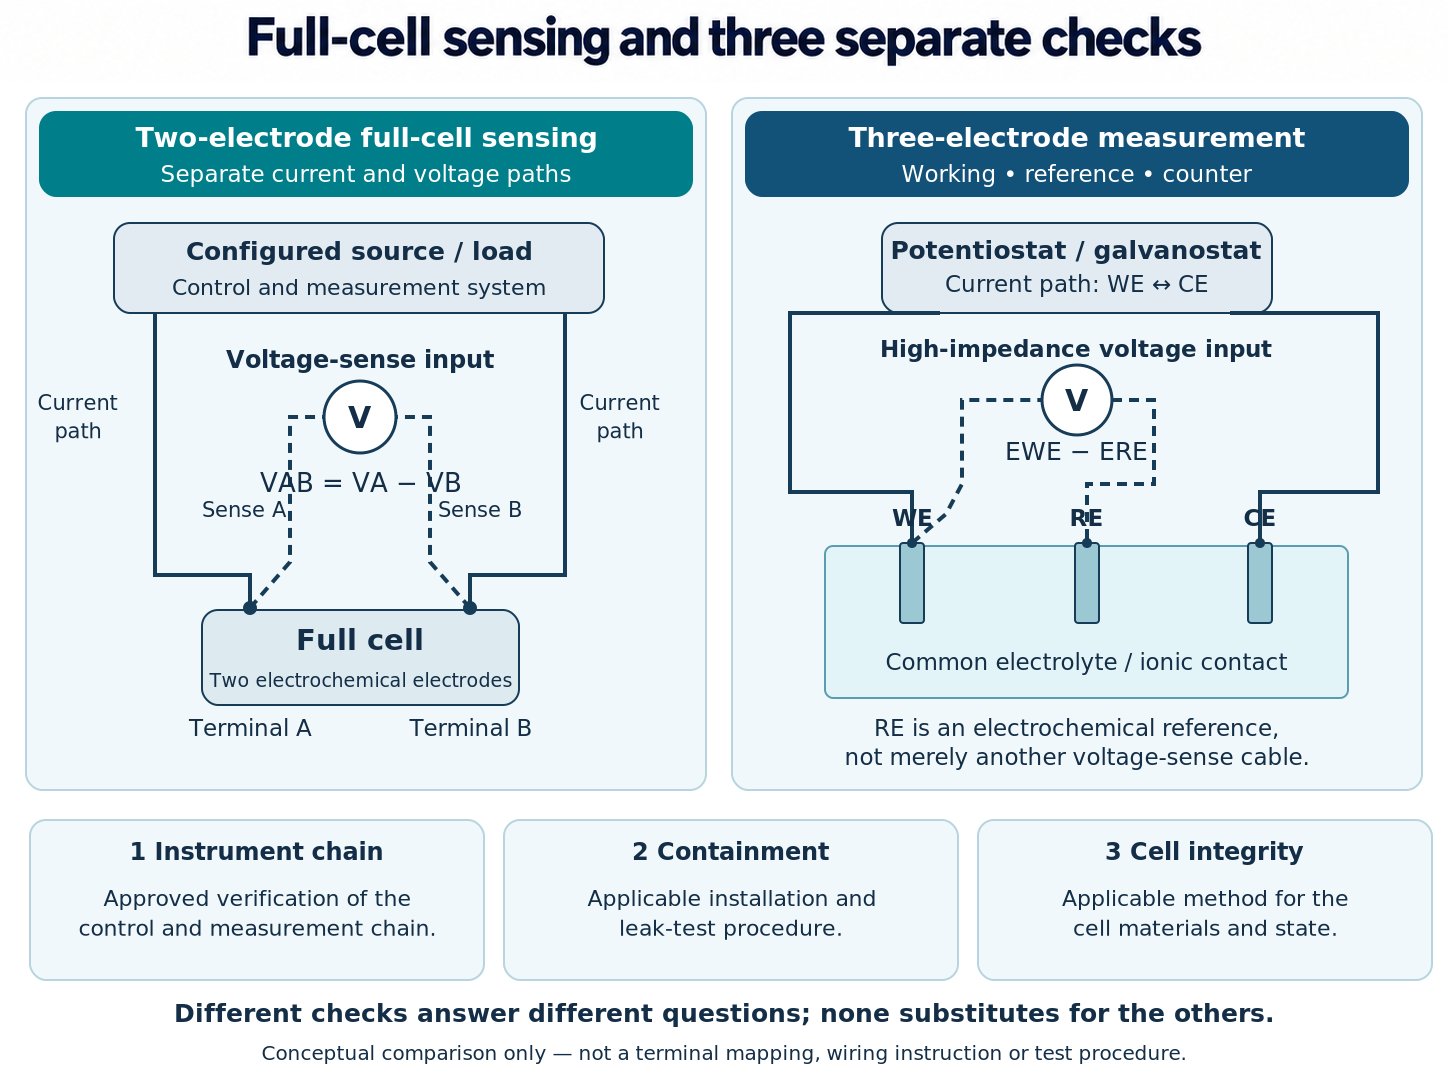
Figure 2. Full-cell sensing and three separate checks. Conceptual measurement boundaries and three independent kinds of acceptance evidence. Instrument-chain verification, containment and actual-cell electrical integrity answer different questions. Use the applicable procedures; no generic ohmmeter, OCV-only, self-discharge or leak-test recipe is implied. The three-electrode sketch illustrates the reference principle, not a validated reference placement inside a PEM MEA.
6. Prepare and record the actual test-station conditions
Electrical data describe the cell under its actual operating conditions. Record that state alongside the trace, rather than save only the values entered in the station software. PEMFC protocols treat feed composition, humidity, flow, temperature and pressure as test variables; PEMWE work likewise treats preparation, thermal management and water supply as essential context. [7, 9, 10]
| Record for both devices | Additional PEMWE context | Additional PEMFC context |
|---|---|---|
| Cell identity, area, components and assembly history. | Water specification, measured quality and loop history. | Hydrogen purity and oxidant composition. |
| Actual temperatures and sensor locations. | Water-feed location, flow and inlet/outlet temperatures. | Gas inlet conditions and humidifier/dew-point records. |
| Pressure on both sides, location and absolute/gauge basis. | Gas–liquid separation and product collection. | Feed-flow basis, utilisation and minimum-flow policy. |
| Conditioning, previous operation and interruptions. | Once-through versus recirculated water and relevant treatment. | Water management, purge history and gas-conditioning history. |
| Accepted installation checks, limits and fault responses. | Applicable product-gas monitoring. | Applicable feed and exhaust monitoring. |
Temperature. Record what each sensor measures: cell hardware, inlet liquid, outlet liquid or gas. A heater setting is not a measured membrane temperature. Keep the same sensor definitions across a comparison.
Pressure and flow. A pressure value needs its measurement location and an absolute or gauge designation. A volumetric gas flow needs reference temperature and pressure, gas calibration and dry/wet basis. A humidified total stream is not automatically the same quantity as dry reactant flow. Do not compare differently defined values merely because both displays say “sccm”.
Water and humidity. For electrolysis, a bottle label saying “DI water” does not establish the quality reaching the cell after circulation through the system. Record the chosen conductivity or resistivity criterion, temperature basis, sampling location and history. For a fuel cell, relative humidity is temperature-dependent: record actual temperatures and the dew-point or humidification basis rather than assuming a humidifier setting describes every position in the cell.
The JRC PEMFC framework and the PEMWE benchmarking literature provide the relevant context for these records; their particular flow and conditioning values should remain attached to their original methods. [7, 9, 10]
Where integrated control of feeds, temperature, pressure and electrical loading—and, where applicable, humidity—is required, see ScienceGears electrolyser test stations and fuel cell test stations for relevant system categories.
Safety is an entry condition. Use the installation’s accepted ventilation, detection, exhaust, material-compatibility and interlock arrangements. The allowed membrane differential pressure and coordinated start-up/shutdown behaviour must be defined for the actual assembly. This article supplies no generic leak-test pressure, purge time, alarm threshold or shutdown order. [18]
7. Build the method sheet before the software sequence
A useful method sheet links the question to both its operating instructions and its evidence. The sequence below is an editorial planning framework; it does not reproduce one standard or replace a laboratory procedure.
Use a laboratory method sheet alongside this section to document the experiment, configuration, acceptance criteria, EIS record and final reporting checks.
Define the primary comparison. Are you comparing baseline voltage at a fixed current density, current sustained at a voltage, time-dependent response or impedance at a defined state? State what will be changed and what must remain matched. Avoid collecting every available technique without a reason for combining the results.
Identify the method’s authority and scope. Record the source publication or protocol, exact section, revision and locally approved adaptations. Distinguish an international technical specification from a harmonised research report or one paper’s experiment. For example, IEC TS 62282-7-1:2025 concerns PEMFC single-cell performance; its published scope explicitly excludes AEM, bipolar-membrane and phosphoric-acid-doped PBI cells. The full applicable document—not its catalogue description—is needed for clause-specific instructions. [8]
Define the permitted window. Record current, voltage, temperatures, feeds, pressures and differential-pressure limits with their sources. The method must fit within both the cell and configured instrument limits. Include the permitted excursions and transitions, not only the intended steady values.
Define acceptance before seeing the result. State the stability metric and its units, observation window, minimum observation, maximum dwell, averaging rule, environmental bands and invalid-data conditions. Define what follows a failed check: repeat, investigate, adjust under an approved method, or stop. Do not leave an undefined wait-until-stable loop running indefinitely.
A sequence that preserves the comparison
| Planning stage | Decision and record |
|---|---|
| Prepare and condition | Use the applicable preparation method; document specimen history and actual accepted baseline state. |
| Measure a baseline | Acquire the agreed performance data under the reference conditions; retain raw transitions and acceptance results. |
| Perform selected holds and EIS | Use only measurements that address the question, with documented state, limits and acquisition settings. |
| Repeat the baseline | Return to matched comparison conditions; disclose any recovery, reconditioning or interruption. |
| Close the experiment | Complete the approved shutdown and final-state checks; archive data, deviations and unresolved interpretations. |
The exact order and conditioning programme remain source-dependent. Lickert and colleagues’ round-robin work shows why preparation, interruptions, thermal control and reconditioning must be documented when laboratories compare PEMWE data. Applying the same nominal equipment or waiting the same number of hours is not enough to establish the same state. [10]
An OCV record may be a useful observation where the method calls for it. It is not a complete performance or containment test. In particular, an electrolyser’s OCV depends on its state and gas history; do not replace the actual protocol with one universal expected value.
Before starting, save the method file and record the cell/MEA identity, active-area definition, current convention, sense points, ranges, environmental channels, sample timestamps, averaging window, fault response and raw-data location. Unresolved fields mean the plan still needs work; a blank limit is not unrestricted permission.
8. Turn a polarisation staircase into accepted data
A polarisation curve relates cell voltage to current density under stated conditions. It is a global performance measurement of the assembled cell. For a current-controlled experiment, convert the approved current-density points to current, impose the sequence and record the voltage response and environmental channels. [6, 11]
At each step, preserve both the commanded current and measured current. Calculate the reported current density from the measured value in the accepted window. Likewise, use the accepted voltage record—not an isolated final reading. Where the chosen protocol requires increasing and decreasing sequences, preserve both and their history. Disagreement is evidence to investigate, not a reason to select the more attractive direction.
Define a reporting window, not just a dwell time
A useful electrical stability metric is a fitted slope over a specified trailing window. For voltage, express that slope in units such as mV/min. Its acceptance threshold and window must suit the method and the required comparison. The electrical result also needs acceptable environmental and instrument conditions: a small voltage slope while inlet temperature drifts is not automatically a matched measurement.
Once the required conditions are met, calculate the selected-window mean and the defined measure of variability. Record the number of readings and sample interval. Keep the preceding transition and any excluded windows in the raw dataset. A fixed dwell can be part of a validated protocol, but elapsed time alone does not demonstrate that another setup has reached the intended state. [9, 10]
Worked example: two accepted windows and one drifting window
Synthetic data only. The following original ScienceGears teaching model uses a 5 cm² cell, three arbitrary 60-second steps and one-second sample spacing. The current values are 2.5, 5.0 and 7.5 A. The assumed current readback equals the commanded current; that equality is an exercise assumption, not a property of real measurements.
Use the final ten readings of each step: times 50–59, 110–119 and 170–179 seconds. For this exercise only, accept an absolute fitted voltage slope no greater than 1 mV/min and assume all environmental and instrument checks pass. Neither the time intervals nor the threshold is a recommended PEM operating value.
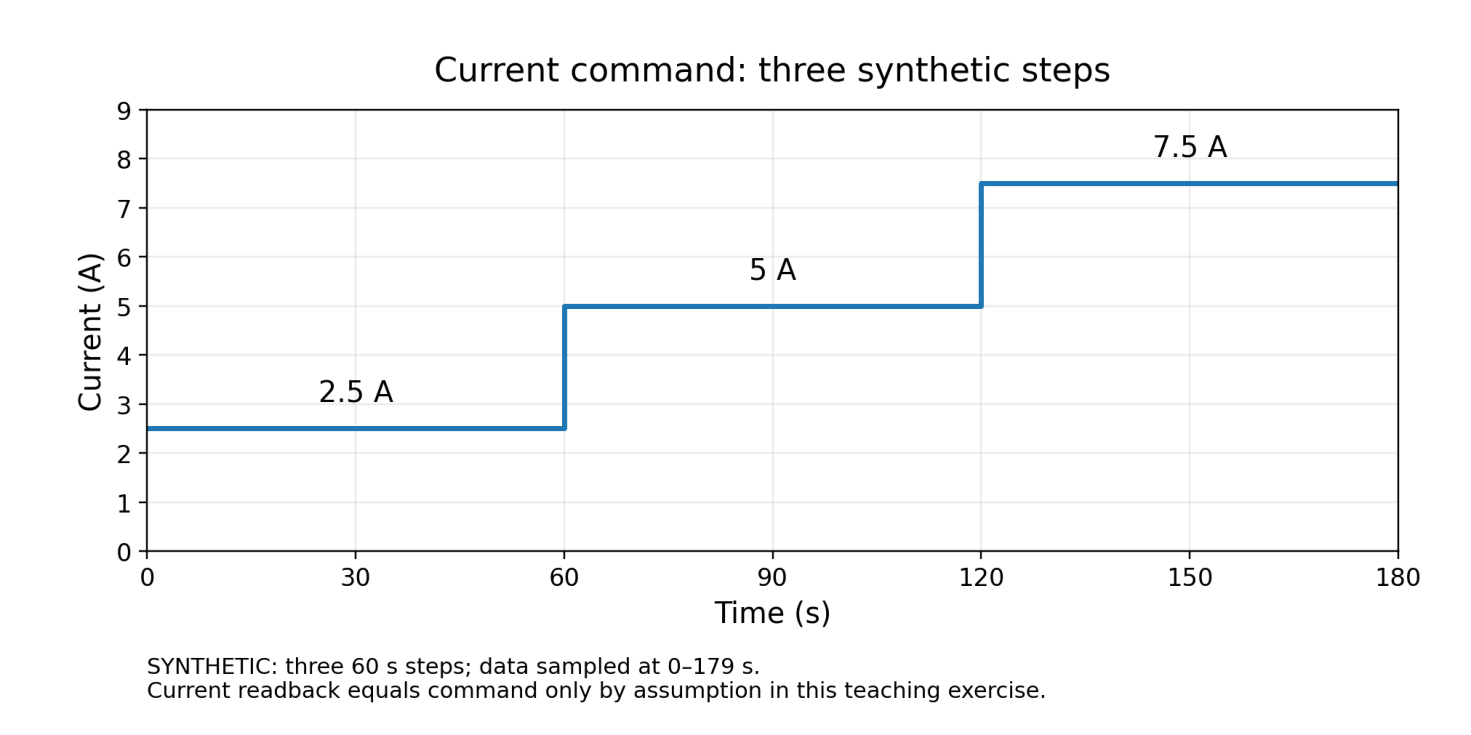
Figure 3a. Raw staircase: commanded current. Synthetic command: 2.5, 5.0 and 7.5 A over three arbitrary 60-second steps. The underlying record contains 180 samples at 0–179 s. Readback equals command only by assumption. These values are not a test programme.
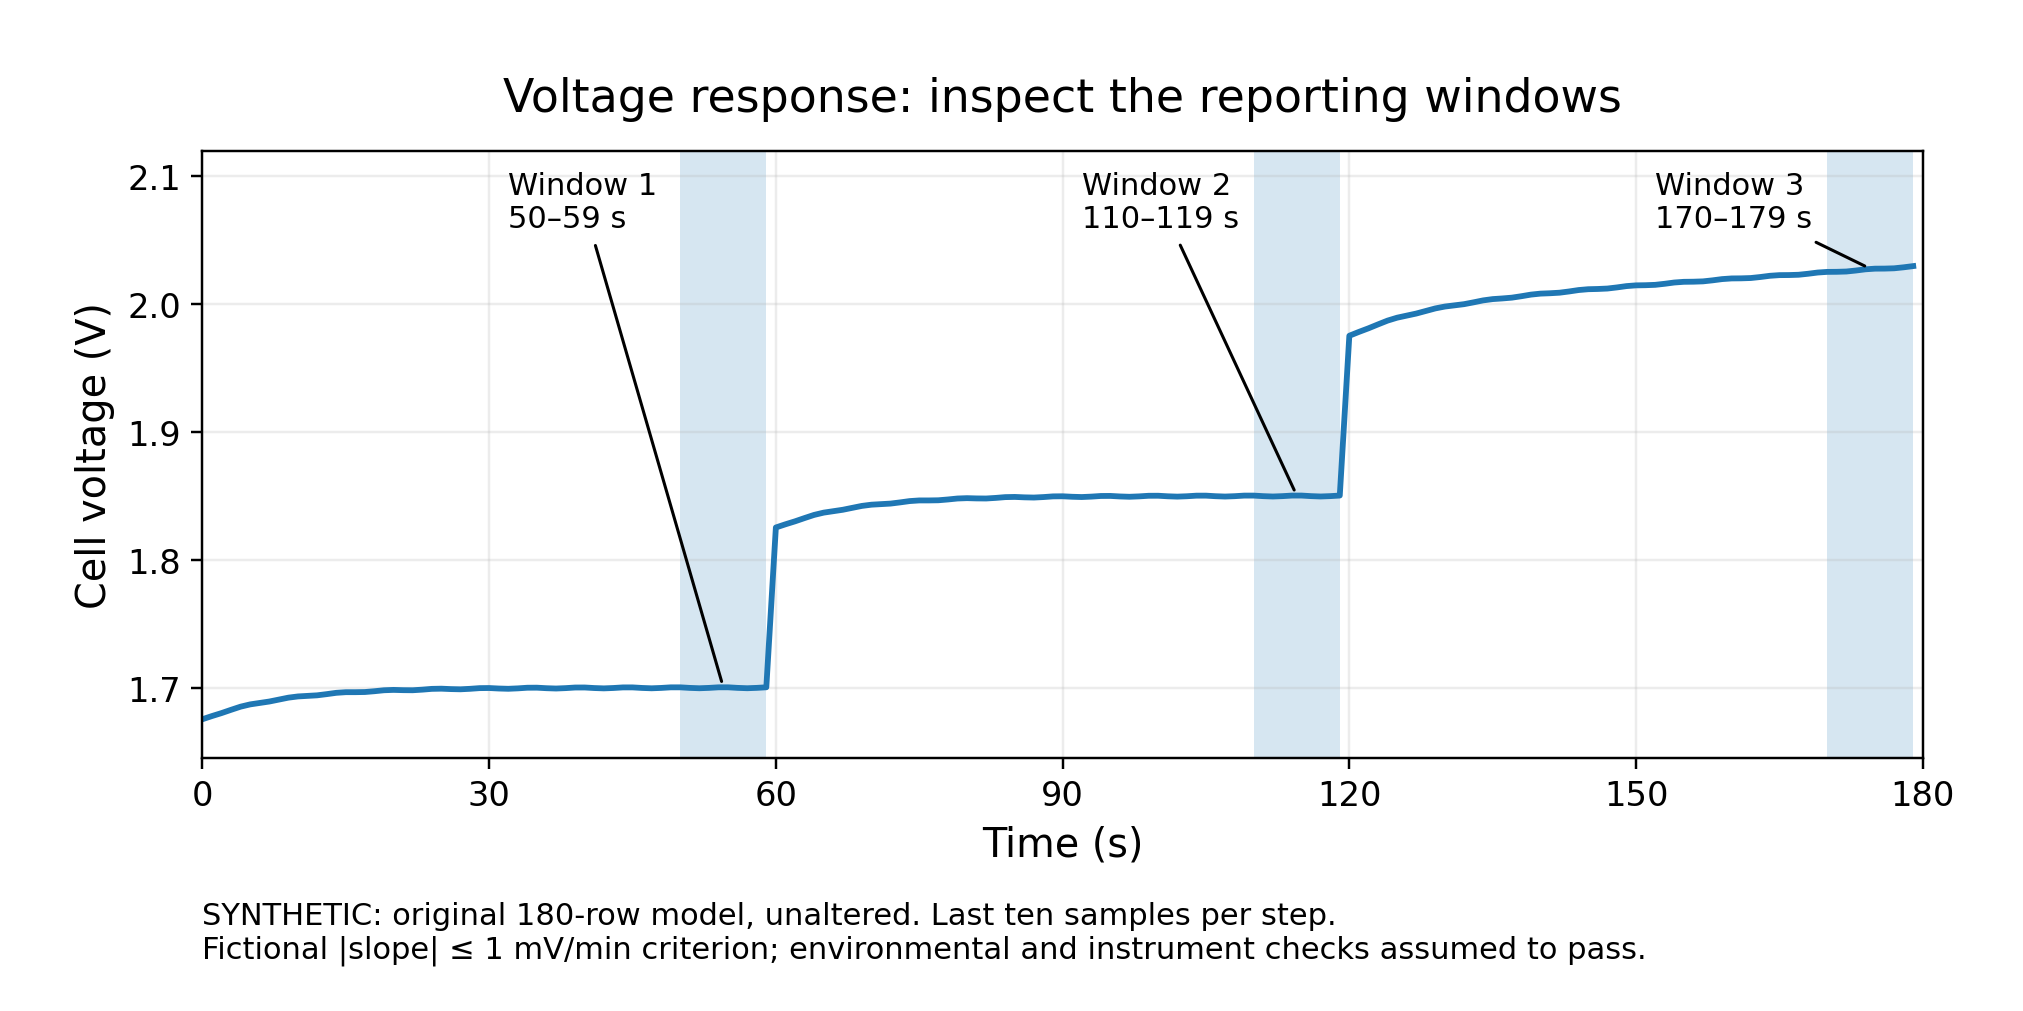
Figure 3b. Raw staircase: voltage and reporting windows. Synthetic voltage response for the teaching model. Candidate windows contain samples at 50–59, 110–119 and 170–179 s. The invented drift limit is 1 mV/min; environmental and instrument acceptance are assumed. The third window fails. Ten one-second-spaced samples span nine seconds.
| Step | Mean I / j | Mean V | Window sample SD | Slope | Exercise decision |
|---|---|---|---|---|---|
| 1 | 2.5 A / 0.5 A/cm² | 1.699971 V | 0.298 mV | 0.214 mV/min | Accepted. |
| 2 | 5.0 A / 1.0 A/cm² | 1.849971 V | 0.298 mV | 0.214 mV/min | Accepted. |
| 3 | 7.5 A / 1.5 A/cm² | 2.027221 V | 1.553 mV | 30.214 mV/min | Rejected: drift. |
Only the first two window means belong in the accepted polarisation dataset under that invented rule. The third trace and its rejection reason remain in the record. Extending a line through its final value would conceal that the planned comparison was not achieved.
The table displays extra digits to make the calculation traceable; they are not a claim of experimental resolution. The final ten samples span nine seconds between the first and last timestamps. Their sample standard deviations describe time-adjacent readings, not ten independent cells or the complete measurement uncertainty. Figure 3c shows only the accepted means; it does not fit a performance curve through two points. If an environmental check failed, a small slope would not rescue the point. [17]
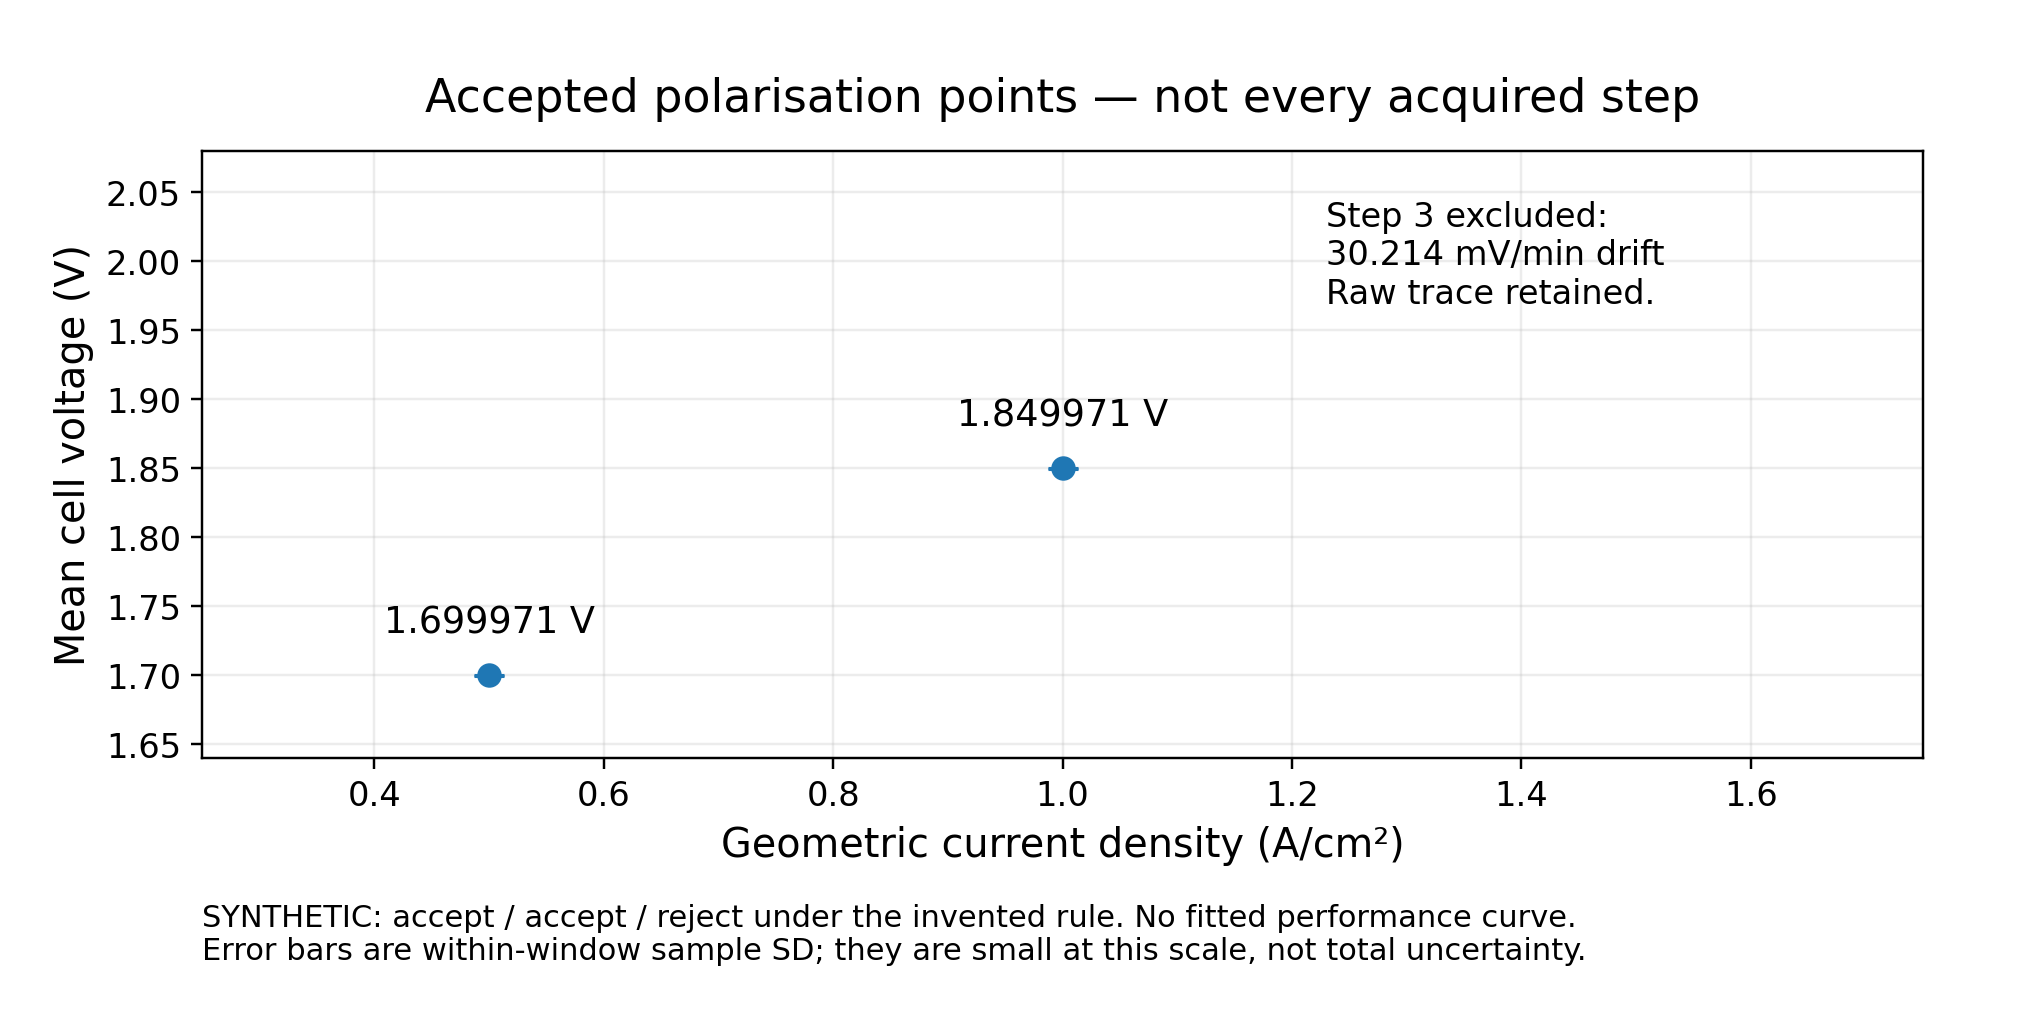
Figure 3c. Accepted polarisation means. Only the first two means pass the teaching rule. The third trace remains in the raw record but is excluded from the accepted dataset. Error bars are within-window sample standard deviations and are small at this scale; they are not total uncertainty or independent-MEA reproducibility. No performance curve is fitted through the two points.
Compare like with like
Plot raw terminal voltage against measured geometric current density. Fuel-cell output power density can be added as pout = Vcellj. For electrolysis, that same positive-magnitude product represents electrical input density—not output or efficiency.
At matched current density and conditions, lower electrolyser voltage means less electrical input per unit charge; higher generating fuel-cell voltage means more electrical output per unit charge. Neither statement alone establishes product recovery, net system efficiency or which component caused the difference. [5, 11, 16]
For voltage-controlled steps, apply the same acceptance logic to the current response and actual operating state. A fast linear sweep is a transient experiment unless its equivalence to the intended steady-state measurement has been established. Report direction, dwell or stability rule, averaging and range changes. Do not extract one electrode’s kinetics from a complete-cell curve without justifying the other contributions.
9. Chronoamperometry and chronopotentiometry
CA: set voltage and observe current
Chronoamperometry records current with time following a change in applied potential. In the full-cell experiments here, the explicitly declared quantity is terminal voltage. A voltage-hold question is: How much current does the cell sustain at this voltage, and how does that response change with time? [1]
For the electrolyser, the source provides the current required at the approved voltage. For a generating fuel cell, a compatible load adjusts the current drawn to maintain an attainable terminal voltage. Record actual voltage, current, conditions and control-limit flags; the programmed voltage is not the entire record.
A current transient can reflect capacitive charging, reaction, transport and changing operating conditions. IUPAC describes conditions under which the Cottrell relationship applies; a porous, gas-fed membrane cell is not automatically that ideal diffusion experiment. Do not fit a convenient transient model without establishing why its assumptions are appropriate. [1, 11]
The retained synthetic CA model makes this distinction clear: after one arbitrary relative voltage step at t = 0, the voltage remains at its new level. One hypothetical current response approaches a final level from above and another from below. Figures 4a and 4b use those original functions. They are alternatives, not simultaneous predictions or measured PEM responses. A downward transient alone is not evidence of catalyst damage.
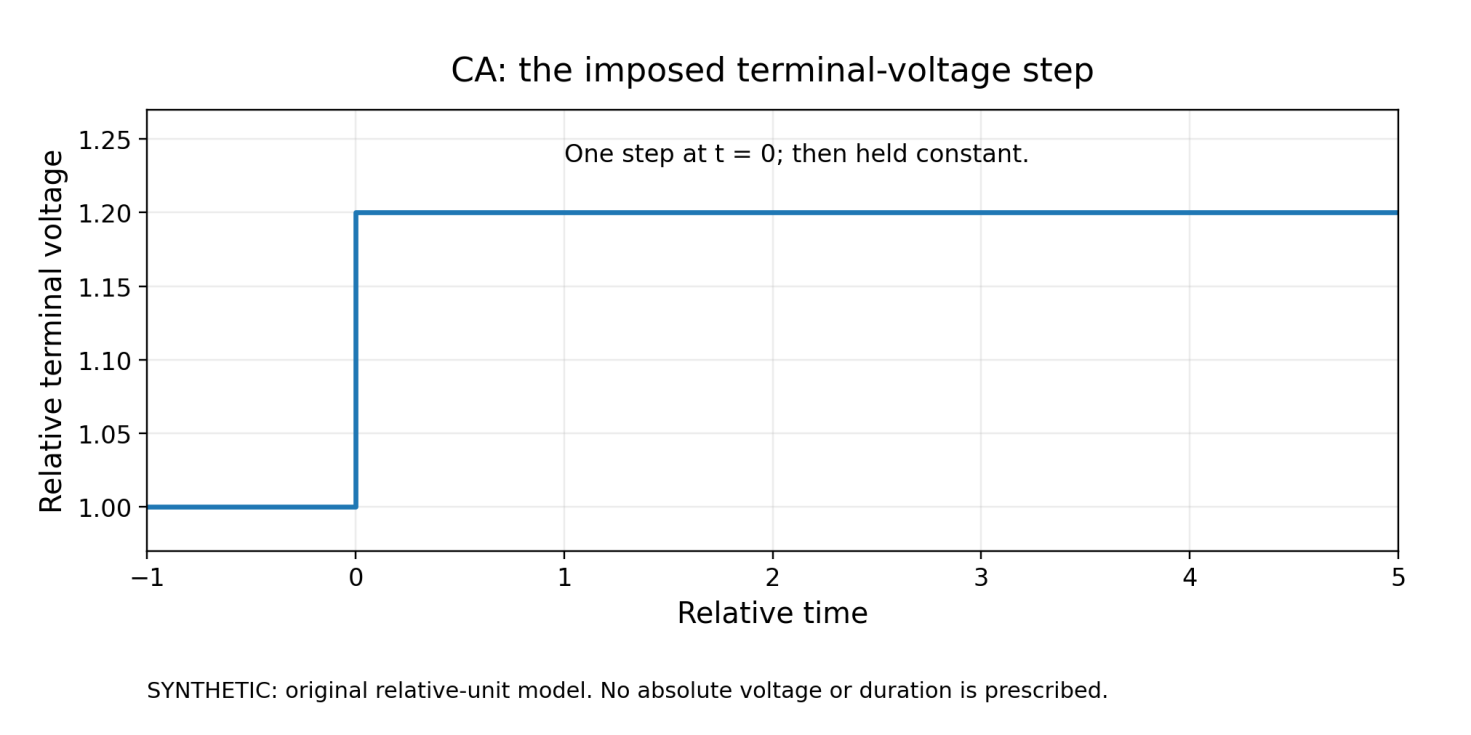
Figure 4a. CA: impose a voltage step. Original synthetic command in relative units: one step from 1.0 to 1.2 at relative time zero, then a hold. Relative time and voltage are not an operating duration or cell-voltage recommendation.
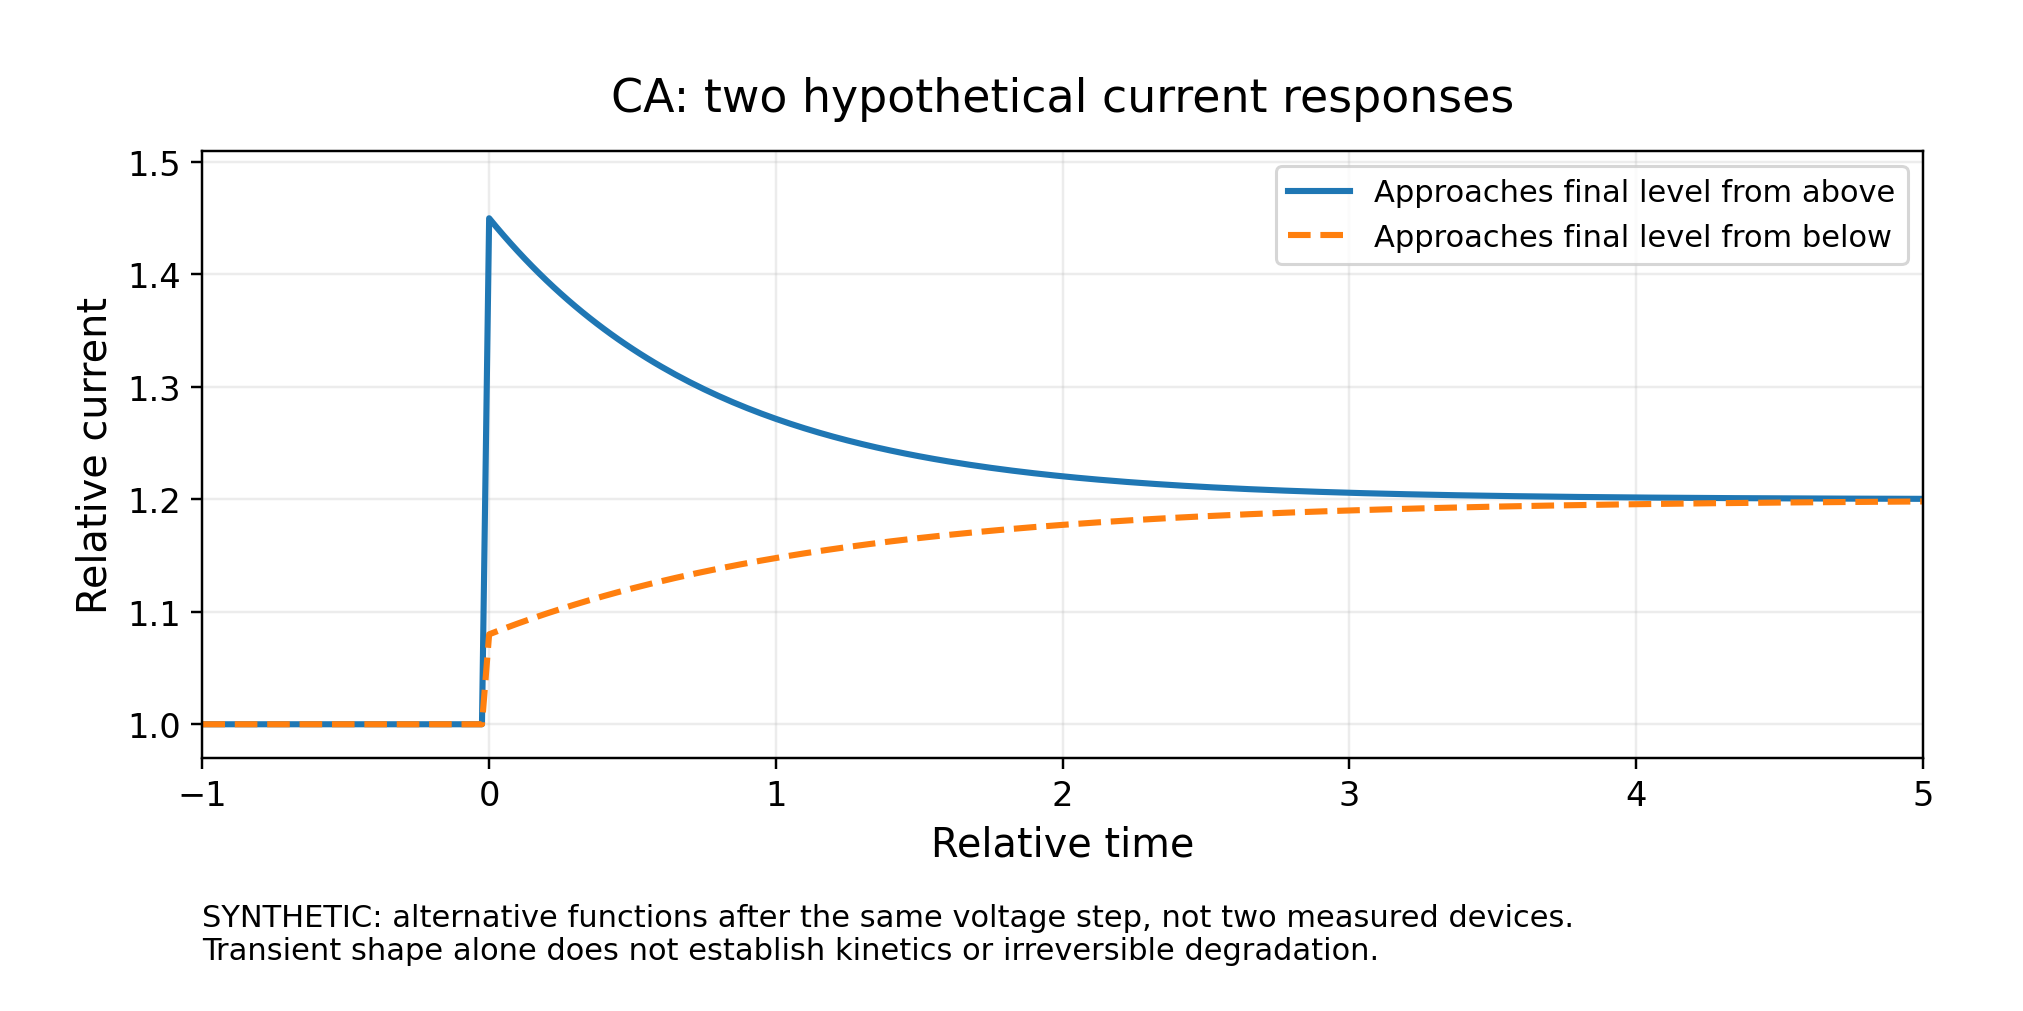
Figure 4b. CA: observe alternative current responses. Two hypothetical current functions follow the same voltage command. One approaches the final relative value from above, the other from below. They are alternative illustrations, not measured devices, mechanistic fits or proof of irreversible degradation.
CP: set current and observe voltage
Chronopotentiometry measures potential with time following a change in applied current. Here it asks what terminal voltage the complete cell requires or delivers at the prescribed current. It is not a constant-power experiment, even where both are abbreviated “CP” in different software contexts. [2]
| At fixed current and matched conditions | Immediate performance meaning | What to investigate before assigning a cause |
|---|---|---|
| Electrolyser voltage rises. | More electrical input is required per unit charge. | Temperature, hydration, water state, contacts, transport and lasting changes. |
| Generating fuel-cell voltage falls. | Less electrical output is delivered per unit charge. | Gas supply, water balance, temperature, contacts and lasting changes. |
| Voltage changes after a current step. | The device is responding to a changed operating state. | Electrical transients, feed/water response and the time needed for the accepted comparison. |
The synthetic CP model uses one relative current-magnitude increase at t = 0 and opposite voltage changes for the two normal operating branches (Figures 4c and 4d). Each voltage change is relative to that device’s own pre-step baseline; it is not an absolute voltage. The current then remains at its new level. The model does not imply identical cell voltages, a universal transient shape or an approved load sequence.
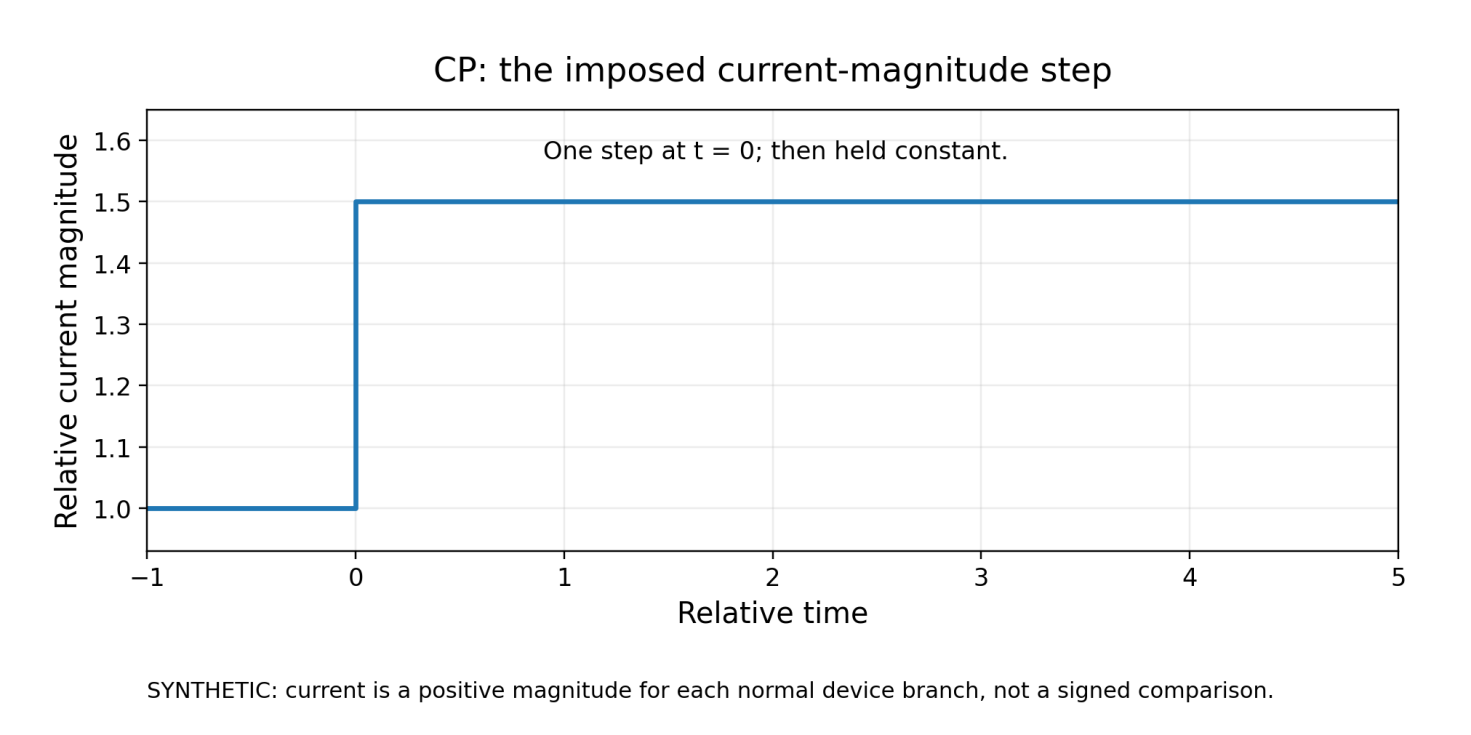
Figure 4c. CP: impose a current-magnitude step. Original synthetic current magnitude rises from 1.0 to 1.5 at relative time zero and remains there. Each normal device branch uses a positive current magnitude; this is not a signed-current or gas-flow programme.
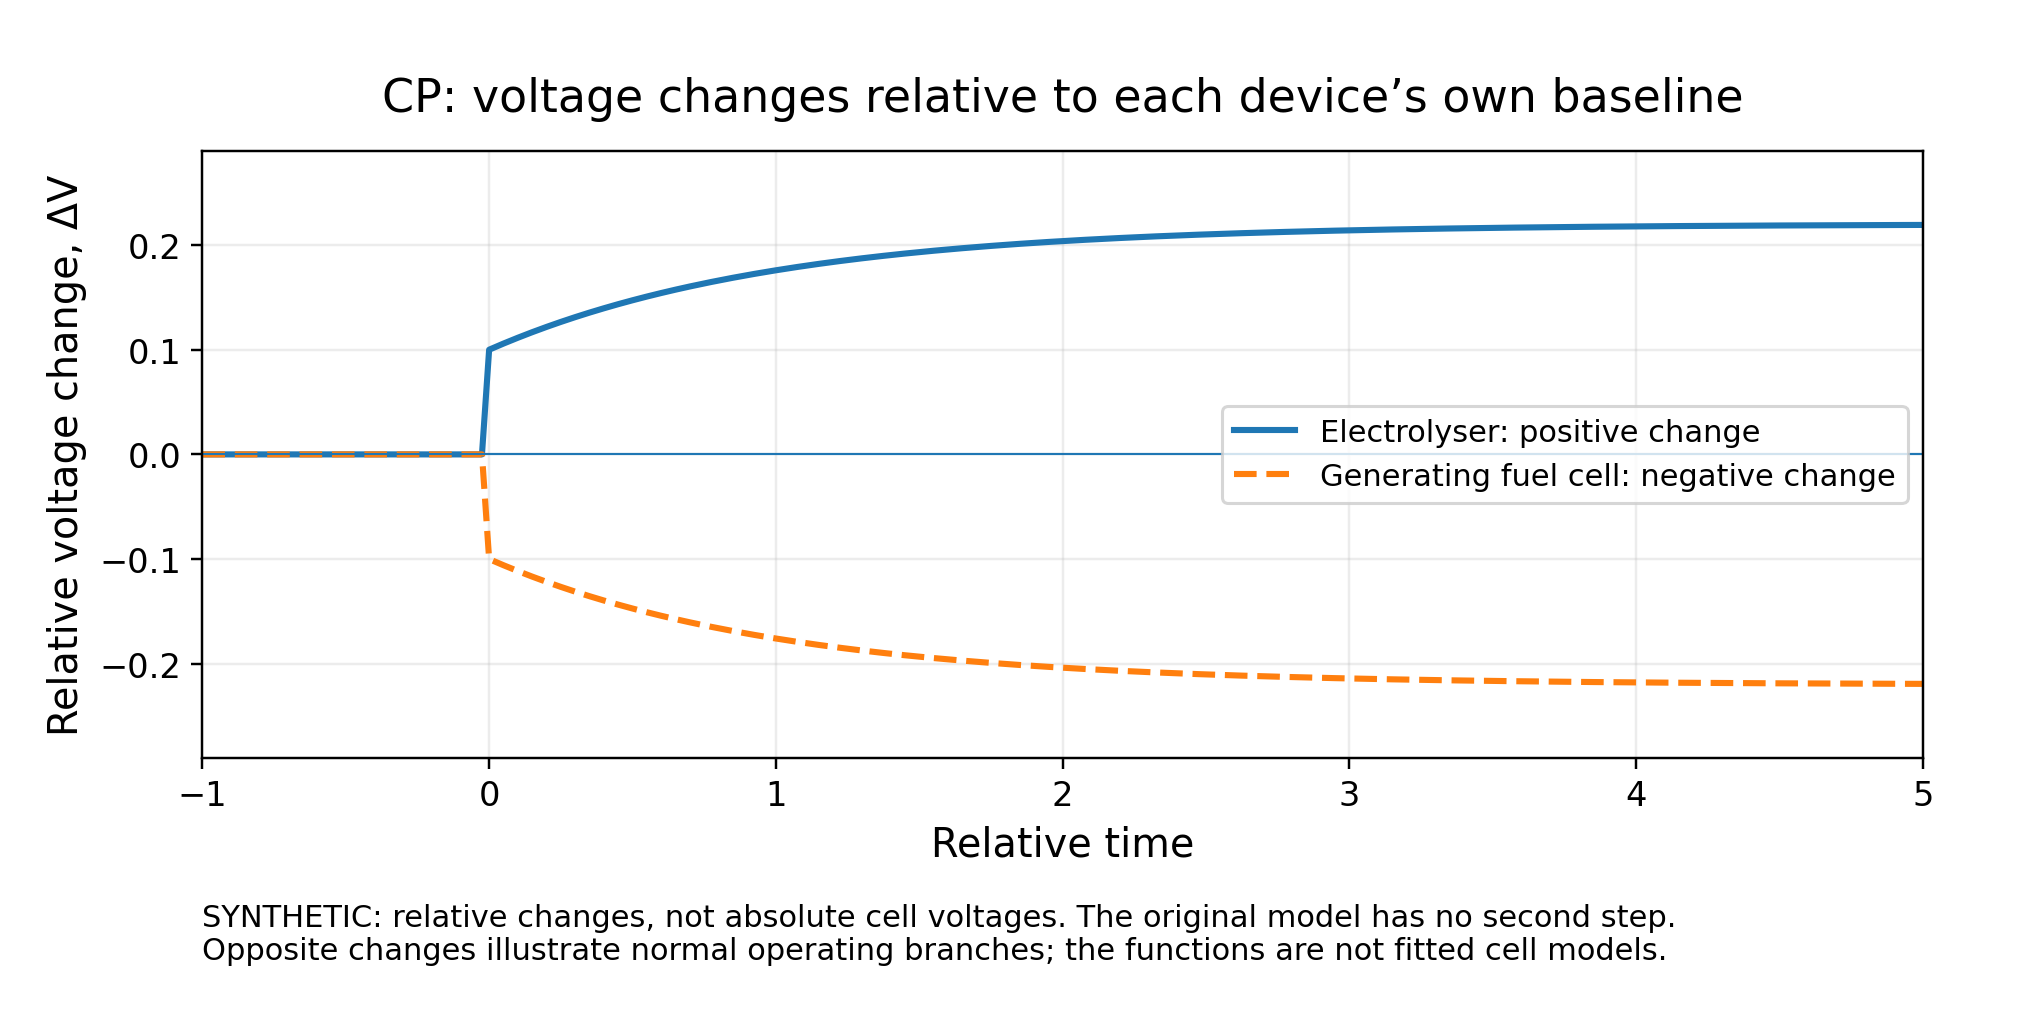
Figure 4d. CP: compare changes from each device’s baseline. Synthetic voltage changes after the same current-magnitude increase: positive for the electrolyser and negative for the generating fuel cell. Each is a change from its own pre-step baseline, not an absolute voltage. The curves are teaching functions, not fitted kinetics or prescribed device responses.
Specify the variable you are not controlling
CA needs permitted current boundaries. CP needs permitted voltage boundaries, including the relevant upper-voltage protection for an electrolyser and lower-voltage protection for a generating fuel cell. Add any other cell-specific limits and the required flow, pressure and thermal responses.
Record ramps, transition behaviour, sampling, duration and averaging. A change of control mode should begin from a compatible state under a validated transition, not an unrelated setpoint. For an apparent durability trend, state the fitted interval and how conditioning and interruptions were treated. A short-term slope is not a validated service-life prediction. A matched post-test baseline and further diagnostics are needed before stronger claims about irreversible change. [10, 13]
10. Add EIS at a defined measured operating state
Choose the perturbation and preserve the DC context
EIS measures the frequency-dependent small-signal voltage/current relationship, including phase, around an operating state. Potentiostatic EIS (PEIS) perturbs voltage and measures current; galvanostatic EIS (GEIS) perturbs current and measures voltage. Either may be useful when the complete configuration supports the state and the required response. The JRC PEMWE method explicitly recognises current or voltage perturbation. [14]
Start with measured DC voltage and current plus stable, recorded temperatures, pressures and feeds. State the actual frequency list and order, range settings, integration/cycles and timestamps. “EIS at 5 A” is incomplete if the cell was still changing or the readback did not achieve the command.
With the current-into-cell convention used above, write the complex perturbations as δṼ and δĨin:
Z(f) = δṼ(f)/δĨin(f)
If current is instead defined as positive fuel-cell output, Iout = −Iin, the equivalent expression is Z = −δṼ/δĨout. Check the instrument’s definition before altering exported signs. Impedance is not the DC ratio V/I.
Make amplitude and time explicit
For a single sinusoidal voltage perturbation, one notation is:
V(t) = VDC + ΔVpeak sin(2πft)
State whether the entered amplitude is peak, peak-to-peak or root-mean-square (RMS). For the zero-mean sinusoidal AC component, peak-to-peak is twice peak, and RMS is peak divided by √2. That relationship does not describe the RMS of the complete waveform when a DC offset is included.
Illustrative headroom check. At one frequency, 10 mV peak across an assumed impedance magnitude of 5 mΩ corresponds to 2 A peak of AC current. This is arithmetic, not a recommended perturbation. For a single sinusoid, a necessary current-bound check is:
IDC − ΔIpeak ≥ Imin and IDC + ΔIpeak ≤ Imax
The limits must include the intended operating regime, not only a hardware maximum. Also check the resulting voltage, power and control behaviour. A multisine signal needs the extrema of the combined waveform. Passing a bound does not establish linearity, stationarity or phase accuracy.
Low frequencies also cost time. At 10 mHz, one period lasts 100 seconds; three periods would take 300 seconds before additional settling or other frequencies. Three is merely a timing illustration here. A longer spectrum is useful only if the operating state remains sufficiently consistent throughout acquisition.
A practical quality sequence
Verify the measurement chain with an appropriate approved arrangement. Choose a frequency/impedance region supported by the actual cell, instrument and cables. Compare suitable perturbation amplitudes and repeat selected measurements. Investigate meaningful changes with amplitude, clipping, overload, range switching, drift or poor repeatability before interpreting a fitted model. Keep the raw real and imaginary data.
External connections can create substantial high-frequency contributions in low-impedance cells. Franzetti and colleagues demonstrate why simply discarding inductive points can distort the inferred resistive response in their PEMWE setup. Their method is configuration-specific, not a general instruction to short a reactive cell or rewire it during operation. [12]
Read the axes before naming an arc
A common Nyquist display plots real impedance Z′ horizontally and −Z″ vertically. With a positive-up vertical axis, a capacitive response with Z″ < 0 appears above the axis; an inductive response with Z″ > 0 appears below it. An inductive feature is not automatically an artefact in every system. Bode magnitude and phase plots provide complementary frequency information. [12]
Synthetic circuit example. For a series resistance R0 followed by a parallel Rp–C combination:
Z(f) = R0 + Rp/(1 + i2πfRpC)
Using the original teaching values R0 = 20 mΩ, Rp = 80 mΩ and C = 0.2 F gives limiting real-axis intercepts of 20 and 100 mΩ. For this ideal circuit, fpeak = 1/(2πRpC) ≈ 9.947 Hz, at Z′ = 60 mΩ and −Z″ = 40 mΩ. Figure 5 uses equal impedance scales and calculates the frequency markers from the same equation. The intercepts are frequency limits, not finite sampled points. These parameters do not identify physical components in a measured MEA. For geometric-area normalisation, ZA = AZ, in Ω cm² when A is in cm².
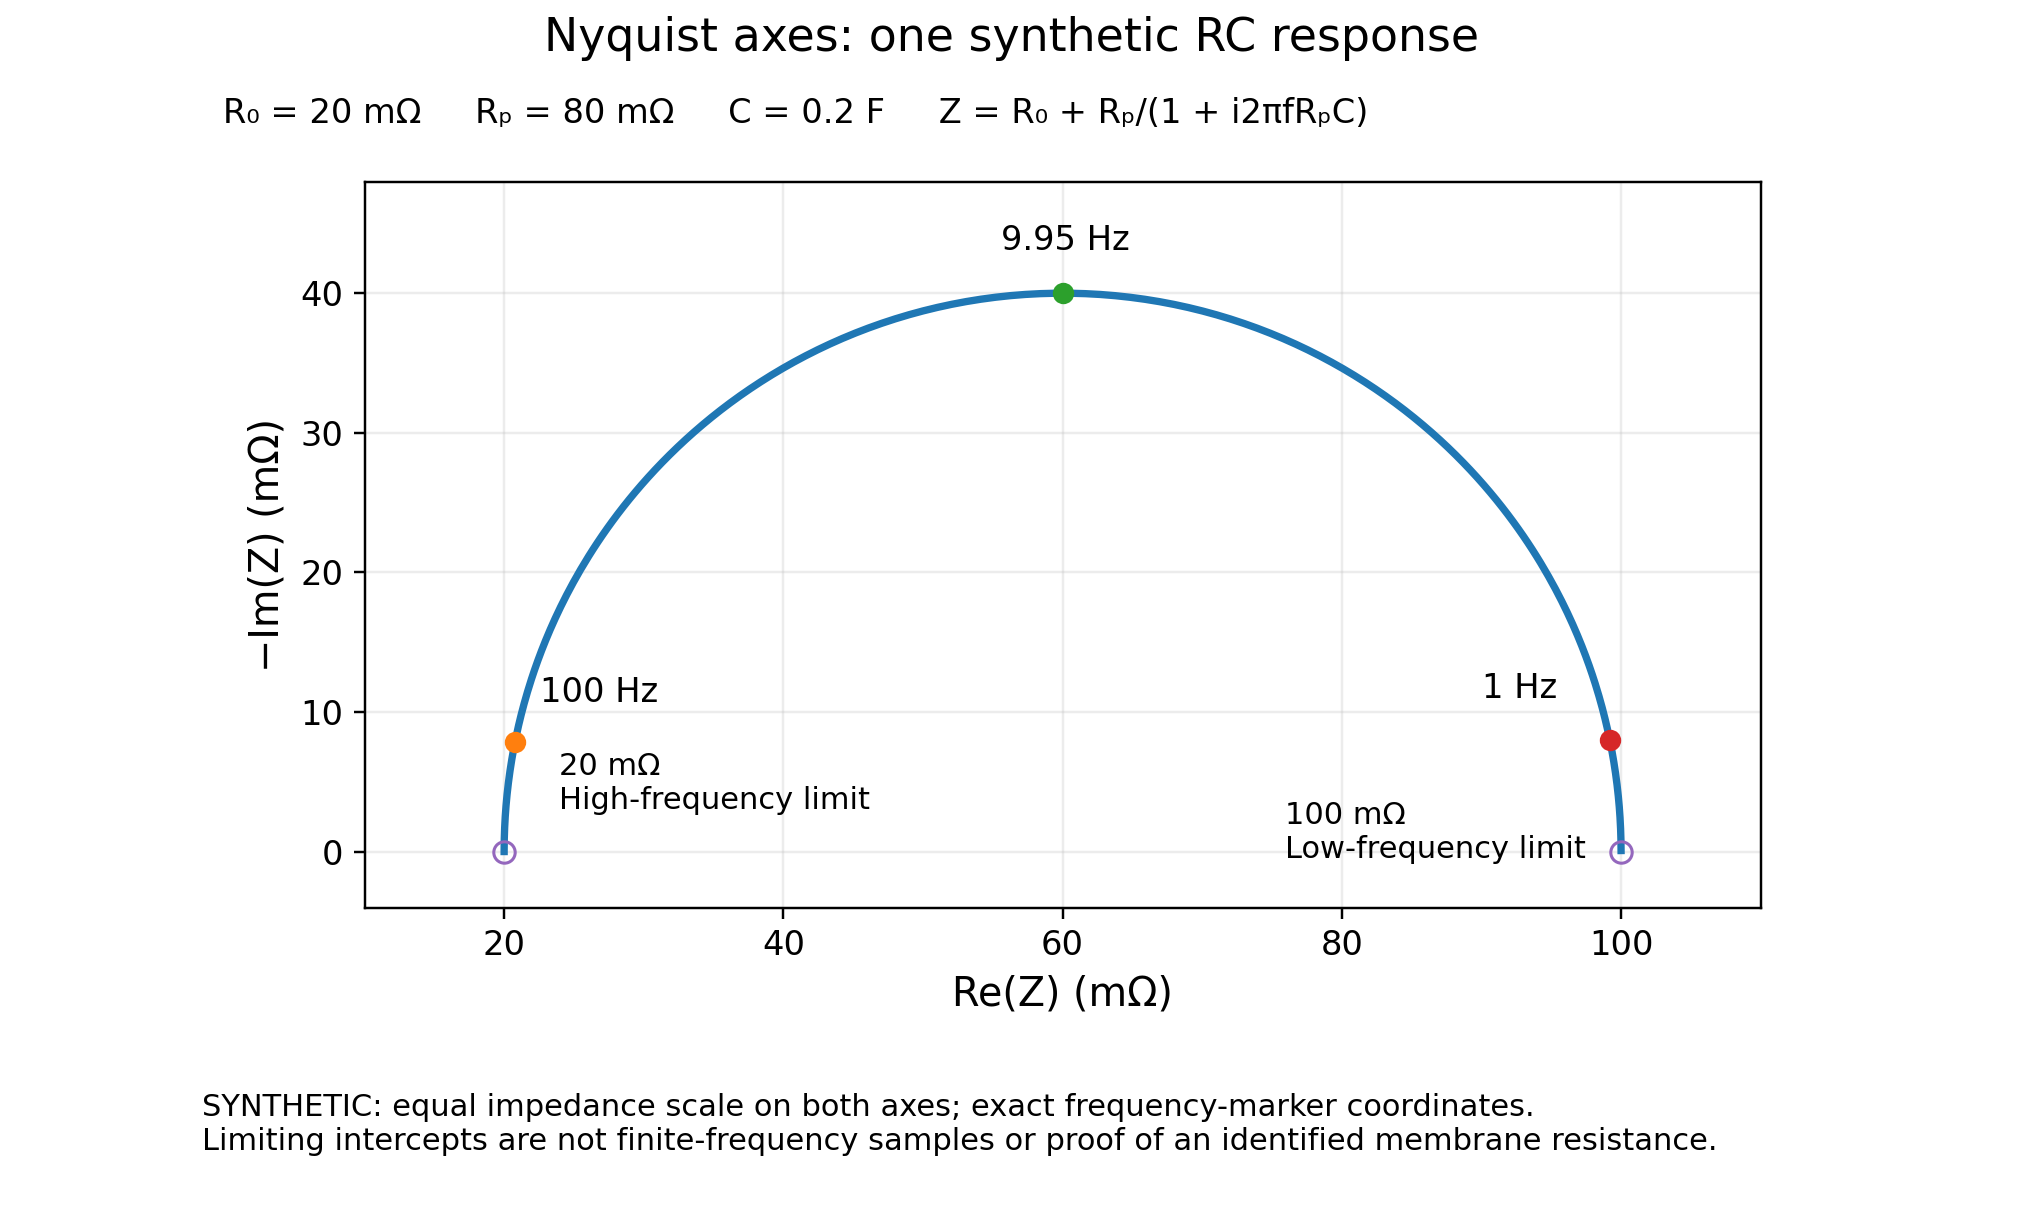
Figure 5. Nyquist axes and the limits of a single-RC example. Synthetic R₀ + (Rₚ parallel C), with R₀ = 20 mΩ, Rₚ = 80 mΩ and C = 0.2 F. Exact markers are computed at 100 Hz, 9.947 Hz and 1 Hz. Open markers at 20 and 100 mΩ denote limiting intercepts, not finite-frequency observations. Both axes use equal impedance scales. These circuit parameters are not independently identified components of a real PEM cell.
HFR is not automatically membrane resistance. High-frequency resistance must be extracted from a sufficiently resolved resistive response, accounting for the measurement boundary and parasitics. It is not necessarily the real part at the single highest sampled frequency. State whether it came from an intercept, extrapolation or model. Contacts and other internal contributions may remain; do not label all of it “membrane resistance” without supporting evidence. [11, 12]
Separate consistency from physical interpretation
The Kramers–Kronig relationships connect the real and imaginary parts under the relevant linearity, causality, time-invariance and mathematical convergence conditions. Lin-KK checks and residuals can help assess consistency, alongside independent checks on the measurement chain, perturbation sensitivity, drift and repeatability. A pass does not select one unique equivalent circuit or prove a degradation mechanism. [15]
Fortin and colleagues provide a useful PEMFC example: changing humidity and cathode stoichiometry changed the measured spectra. Their model assignments belong to their controlled comparison. The lesson is to inspect the operating environment before interpreting a larger impedance feature as lasting catalyst damage; multi-sine acquisition is not required for this basic reasoning. [13]
The compact EIS record should therefore retain six groups: DC state; control and range; AC request; frequency/timing; validity checks; and interpretation assumptions. This is the bridge between a plotted spectrum and a reproducible measurement.
11. Calculate useful quantities without overstating them
Area-specific resistance and ohmic correction
For resistance R in ohms and geometric area A in cm²:
RASR = RA [Ω cm²] and ΔVohmic = ImagR = jRASR
Multiply resistance by area, not divide it. Use a resistance that matches the relevant operating state and sensing boundary. With positive current magnitudes, a simple post-processed correction has opposite directions:
Electrolyser: ViR-free = Vmeasured − ImagR
Fuel cell: ViR-free = Vmeasured + ImagR
Original teaching example. For 5 A, 20 mΩ and 5 cm², the assigned ohmic drop is 0.100 V and ASR is 0.100 Ω cm². The earlier 1.90 V electrolyser value becomes 1.80 V after this correction; the 0.65 V fuel-cell value becomes 0.75 V.
That correction removes the assigned ohmic term. It does not automatically remove transport losses or isolate one electrode’s kinetics. Preserve both datasets and explain the resistance extraction. Post-processing is also different from real-time feedback compensation; a corrected literature plot is not an instruction to enable aggressive online compensation. [11]
Actual electrical energy uses raw terminal data
For the stated sensing boundary, calculate electrolyser input as ∫VcellImagdt, and generating fuel-cell output as ∫VcellIoutdt. Use raw terminal voltage and aligned measured current—not the iR-corrected curve. Extending to system efficiency requires accounting for the relevant pumps, heaters, cooling, gas handling and power conversion. [5]
Charge is not measured hydrogen
For a defined interval of ordinary, unidirectional electrolysis, Q = ∫Imagdt. The water-splitting stoichiometry gives nH₂,theoretical = Q/(2F) and nO₂,theoretical = Q/(4F). At an assumed constant 5 A for one hour, Q = 18,000 C and theoretical hydrogen is approximately 0.093279 mol using rounded F = 96,485 C/mol. Do not integrate absolute current through a reversal or a different diagnostic and label it all hydrogen-producing charge.
For hydrogen attributed to the same interval and declared collection boundary, the collected-product Faradaic efficiency is FEH₂,collected = 2FnH₂,collected/Q; multiply by 100 for a percentage. Account for background product, calibration, sampling-time alignment and changes in gas inventory. Water vapour, leaks, holdup and crossover affect recovery. A collection-based result is not automatically identical to the selectivity of the electrode reaction. [16]
As a conditional electrical-only illustration, unity hydrogen yield and the stated standard-state higher-heating-value (HHV) basis give approximately 1.48/1.90 = 77.9% at 1.90 V, excluding auxiliary loads and heat input. This is not measured system efficiency. An electrical-only ratio can exceed 100% below the corresponding HHV-equivalent voltage because electricity is not then the only energy input. Account for heat and reactant/product states in the complete balance. The HHV-equivalent reference voltage is not a universal operating-temperature thermoneutral value. [5]
12. Recognise when the experiment is a different diagnostic
Full-cell performance testing is not interchangeable with catalyst-surface characterisation, crossover measurement or a hydrogen-pump experiment. A diagnostic can require different gases, reaction direction, reference electrodes, potential limits and analytical controls. Its apparently familiar technique label does not mean the ordinary generating or electrolysis conditions remain appropriate.
Before adding a diagnostic, state the new question and establish the applicable published method for the actual cell. Identify the required preparation state, electrical reference, control envelope, product evidence and return-to-baseline procedure. A change to the setup can change the object being measured; the resulting evidence should remain a separate record.
Likewise, integrated voltammetric charge or a capacitance value is not automatically a universal electrochemically active surface area across different catalyst chemistries. Explain the reaction and conversion used, and the conditions under which the interpretation is justified. Full-cell voltage alone cannot supply the missing electrode-resolved information. [11]
Keep these diagnostic boundaries visible in the experiment plan. This guide does not supply a new crossover, ECSA or reference-electrode-construction protocol.
For related cell hardware, reference electrodes and other supporting components, see ScienceGears electrochemistry accessories.
13. Complete the experiment and report reproducible evidence
Repeat the comparison, then close the system
A before-and-after comparison should return to the same declared temperatures, feeds, pressures, sensing boundary and preparation context. Disclose any recovery or reconditioning rather than treating it as an invisible reset. A measurement after changing conditions cannot by itself isolate irreversible change. Benchmarking studies show why interruptions and history belong in the comparison. [10]
Then follow the approved coordinated shutdown. Electrical unloading, gas management, water circulation, cooling and depressurisation must be handled as the actual installation requires. Verify the final state before disconnection or disassembly and save the shutdown record. There is no universal “turn the potentiostat off first” instruction that this article can safely supply. [18]
Distinguish time-sample variability from experimental replication
Within-hold variability concerns readings within one averaging window. Repeat runs repeat a method on the same assembly. Reassembly comparisons include rebuilding the cell. Between-MEA comparisons include independently prepared specimens. State which conditions changed, which remained fixed and which question the repeats answer; these different designs should not all be labelled measurement repeatability. [17]
Thousands of adjacent readings from one hold are not thousands of independent MEAs. A small within-window standard deviation does not establish voltage accuracy, and a high-resolution display does not supply a complete uncertainty estimate. Instrument calibration, ranges, area definition, environmental measurements and data processing may all contribute. Metrology terminology distinguishes repeated-value agreement from uncertainty in the reported result. [17]
Choose the replication and measurement quality needed for the comparison—not an arbitrary universal sample count. A few millivolts of difference require evidence that the complete experiment can resolve that difference under the stated conditions.
Best-practice reporting checklist
| Record group | What another researcher needs to understand |
|---|---|
| Device | Cell/MEA identifiers, technology, active-area definition, components, relevant loadings, assembly and prior history. |
| Conditions | Actual temperature/pressure locations and bases, feed composition/flow, water or humidity context, conditioning and interruptions. |
| Electrical setup | Instrument, booster/load, software, current ranges, sign convention, sensing boundary and verification evidence. |
| Method | Source and local revision, sequence, setpoints, ramps, observation/stability rules, sampling, averaging, limits and deviations. |
| EIS and calculations | DC state, perturbation convention, frequencies, validity checks, normalisation, HFR/model assumptions and raw/corrected distinction. |
| Evidence and closure | Raw data, environmental logs, rejected points, faults, analytical calibration where needed, repeat definitions and completed shutdown record. |
This checklist adapts the existing ScienceGears planning framework. It is a reporting aid, not a compliance certificate. A useful final result states what was observed, under which conditions, what conclusion follows and which alternative explanations remain.
14. Common mistakes and a diagnostic decision path
| Common mistake | Better practice |
|---|---|
| Treating a software current sign as proof of power direction. | Define terminal polarity, current direction and signed power. |
| Treating 0 V as open circuit. | Distinguish terminal command, stored-OCV offset, observation and output-off behaviour. |
| Calling four wires four electrochemical electrodes. | Identify current paths, sense locations and any actual reference electrode. |
| Entering current density as current. | Convert using the documented active geometric area. |
| Calling every fixed-dwell or fast-sweep point steady state. | Apply and report the accepted electrical and environmental criteria. |
| Deleting an inconvenient drifting point. | Retain the trace and document the pre-agreed rejection response. |
| Calling the highest-frequency point membrane resistance. | Resolve the resistive contribution and state the sensing and extraction boundary. |
| Treating a good EIS fit or short voltage slope as a complete diagnosis. | Check measurement validity, conditions, matched repeats and independent evidence. |
| Using corrected voltage to report actual terminal energy. | Calculate that energy from aligned raw voltage and current. |
| Assuming a completed software run means a safe final state. | Complete the approved system shutdown and verification. |
For an unexpected result, investigate in a defined order. First inspect faults, overload and control limits. Then compare actual feeds, water/humidity, temperatures and pressures against the acceptance record. Next check ranges and sensing consistency using the approved measurement-chain checks. Only then use matched baselines and targeted diagnostics to investigate changes in the cell.
This is a reasoning sequence, not permission to override an interlock. Preserve the original evidence and the approved response to each failure. An observation, a plausible hypothesis and a demonstrated mechanism should remain clearly different statements. [10, 11, 12, 13, 15, 18]
15. Decision matrix: match your PEM measurement to the right ScienceGears product
| Application | Recommended measurement | Specific product | Key rationale | Key constraint |
|---|---|---|---|---|
| PEM electrolyser polarisation (current-controlled staircase) | Current-controlled polarisation staircase | Potentiostats / Galvanostats; Current Boosters where the base instrument cannot support the current | Section 8: current steps make prescribed current-density comparisons direct. | Section 4: confirm source capability at the actual cell voltage and current. |
| PEM electrolyser: current sustained at a set terminal voltage | CA or voltage hold | Potentiostats / Galvanostats | Section 9: answers how much current the cell sustains at a given voltage. | Define permitted current boundaries before the hold. |
| Generating PEM fuel cell polarisation | Current-controlled staircase, load drawing current | Programmable DC Electronic Loads; Regenerative DC Electronic Loads | Section 1: the generating fuel cell feeds a controlled electronic load. | The cell remains the electrical source; confirm the load supports the requested point. |
| Generating PEM fuel cell: current at a set terminal voltage | CA or voltage hold | Programmable DC Electronic Loads | Section 9: the load adjusts the current drawn to hold an attainable terminal voltage. | Only an attainable voltage can be held; record limit-flag events. |
| Voltage response at a set current, either device | CP or current hold | Potentiostats / Galvanostats (electrolyser); Programmable DC Electronic Loads (fuel cell) | Section 9: reports the terminal voltage the complete cell requires or delivers at the prescribed current. | Define upper-voltage (electrolyser) or lower-voltage (fuel cell) protection. |
| Frequency-dependent response at a defined state | Potentiostatic or galvanostatic EIS | Potentiostats / Galvanostats | Section 10: preserve the DC context and the raw complex impedance. | For fuel-cell EIS, verify load/EIS interface compatibility. A configuration that supports a DC hold does not automatically support EIS (Section 4). |
| Individual electrode potentials | Three-electrode arrangement with a reference | Reference Electrodes | Section 5: full-cell voltage alone does not reveal both electrode potentials. | Needs a suitable geometry and interpretation inside a membrane cell. |
| Single-cell MEA hardware: technology-specific selection | Full-cell polarisation, CA, CP, EIS | Metal Bipolar Plate MEA Electrolysis Test Cell (Ti/Ni/SS); Graphite Bipolar Plate MEA Electrolysis Test Cell | Section 5: match the cell hardware and measurement boundary to the experiment. | Do not assume PEMWE suitability: confirm acidic oxygen-side plate/coating compatibility (especially graphite, Ni or stainless steel), area and limits. [21] |
| Observing gas evolution during operation | Full-cell testing with optical access | Visual MEA Electrolysis Test Cell | The product page describes optical windows for in-situ imaging and diagnostics. | Imaging does not replace the acceptance checks in Section 5. |
| Comparing flow-field arrangements | Design review first; matched full-cell comparison only with a verified current-collection path | Interchangeable Flow Field MEA Electrolysis Test Cell | Section 6: flow, pressure and temperature must be recorded and matched. | PTFE flow-channel material is electrically insulating. Verify the separate conductive current-collection path, wetted materials and identical sensing points before making a full-cell comparison. [22] |
| Integrated electrolyser control (feeds, temperature, pressure, loading) | Station-based PEMWE testing | PEMWE - Proton Exchange Membrane Water Electrolyser; Electrolyser Test Stations | Section 6: record the actual cell conditions alongside the electrical trace. | System-supply scope must be confirmed for the actual configuration. |
| Integrated fuel-cell control including humidity | Station-based PEMFC testing | PEMFC – Proton Exchange Membrane Fuel Cell; Fuel Cell Test Stations | Section 6: humidity, flow and temperature are test variables. | Record dew-point or humidification basis, not only the humidifier setting. |
16. Frequently asked questions
Can one workstation test both PEM devices?
Yes, when the complete configuration supports the required source and sink operating points, sensing and diagnostics. The same software technique name does not establish this. Confirm the actual configuration before constructing the method.
Is open circuit the same as setting 0 V?
No. Open circuit is an observation without intentionally imposed external current. A 0 V terminal command is active control; a zero stored-OCV offset is a different reference again. Output-off behaviour must also be checked separately.
Should I use current or voltage control first?
Choose from the scientific comparison. Current steps make prescribed current-density comparisons direct; voltage holds answer how much current is sustained at that voltage. Both require a permitted window, acceptance criteria and limits on the uncommanded variable. [1, 2]
Does full-cell measurement require a separate reference electrode?
Not for terminal voltage and current. Individual-electrode potentials require an appropriate electrochemical reference arrangement and interpretation. Separate Kelvin leads alone do not provide that information. [11]
Can I use one dwell time for every polarisation point?
Only as part of a method whose suitability has been established for the intended comparison. A fixed dwell does not guarantee the same physical state on every setup. Retain the required stability and environmental checks. [9, 10]
What should happen to a drifting point?
Keep its raw trace, flag why the point failed and follow the pre-agreed repeat, investigation or stop procedure. Do not silently substitute the last value or change the acceptance rule after seeing which result looks best.
Is falling CA current or changing CP voltage proof of degradation?
Not by itself. Check the actual conditions and measurement state, then compare matched baselines and targeted diagnostics. The trace establishes a response; attributing it to irreversible material change requires further evidence. [10, 13]
Is the highest-frequency point the membrane resistance?
Not automatically. Determine whether a resistive contribution is resolved, how parasitics were treated and what lies within the sense points. State the HFR extraction method rather than rename one frequency point. [11, 12]
Does a good circuit fit or Kramers–Kronig pass prove the mechanism?
No. Fit quality, consistency with the relevant assumptions and physical attribution are separate questions. Overlapping processes and non-unique models require controlled comparisons and other evidence. [11, 15]
Can I use iR-corrected voltage for efficiency or copy the example settings?
Use raw terminal voltage and current for actual energy at that boundary. The numbers in this guide are teaching assumptions, not executable settings or measured product yields. Efficiency also requires its stated material and energy accounting basis. [5, 16]
When does a PEM single-cell setup need a booster or electronic load?
Use additional source or sink hardware when the base instrument alone cannot support the required current, voltage or continuous power at the actual cell operating point. Verify the complete configured system, including protected-variable limits, sensing and EIS capability, rather than assuming that a DC hold guarantees the required dynamic measurement.
Why should PEM gas flow be reported with reference temperature, pressure and dry/wet basis?
Because a volumetric flow value is not fully defined without its reference conditions and calibration basis. A humidified total stream is also not automatically equivalent to dry reactant flow, so these details are necessary for meaningful comparison between tests.
What should be defined in the method sheet before the software sequence is started?
Record the scientific question, source method and local adaptation, permitted operating window, sensing boundary, actual supporting conditions, stability and averaging rules, uncommanded-variable limits, fault response, sampling and raw-data location before running the sequence.
When should a measurement be treated as a separate diagnostic rather than ordinary full-cell performance testing?
Treat it as a separate diagnostic when the question requires a different gas environment, reaction direction, reference-electrode arrangement, electrical reference, control envelope or independent analytical evidence. Keep its preparation, limits, data and return-to-baseline procedure distinct from the normal performance record.
17. Expert support how ScienceGears works alongside your research
ScienceGears is founded and led by researchers, and its technical team is PhD-trained with practical laboratory experience. This guide was written by Dr. Siva Arumugam, Ph.D. in Electrochemistry, and the team supports researchers across Australia and New Zealand.
Pre-purchase measurement planning
Planning a PEM measurement sequence or reviewing an unexpected polarisation, hold or EIS result? Share the experimental question, cell and active area, electrical configuration, actual operating conditions, source method and raw records with the ScienceGears technical team.
Configuration and measurement-requirement review
That information provides a useful basis for discussing measurement requirements, suitable potentiostat/galvanostat configurations, MEA test cells and the interfaces needed for your study. Equipment suitability and any system-supply scope must be confirmed for the actual configuration.
Complete system supply
Stock and dispatch confirm availability
Stock location, configuration, dispatch timing and delivery estimates depend on the specific order. Please ask the ScienceGears team to confirm current availability and shipment arrangements before placing an order.
The practical conclusion: define the state, preserve the evidence and make the interpretation earn its level of certainty. A programme that finishes and a dataset that answers the question are not necessarily the same thing.
— ScienceGears Technical Team
18. Further reading
Related ScienceGears reading
For the physical components, start with What is a membrane electrode assembly? Keep the definitions, assembly record and measurement boundary consistent as you move from component selection to full-cell testing.
Scientific notes and further reading
The workflow, acceptance framework and numerical exercises are an educational synthesis adapted from the existing ScienceGears PEM guide and planning materials. The staircase, waveform and RC examples are synthetic; no ScienceGears cell was operated to produce them. Literature examples are identified as published research, not recreated as customer or in-house results.
The references below distinguish terminology, official scope records, research methods, diagnostic studies and metrology. Catalogue access is not a review of a complete standard. Consult the applicable full procedure and equipment documentation before selecting executable values. Detailed source-access and revision notes are retained in the ScienceGears editorial record.
[1] IUPAC. Chronoamperometry. Compendium of Chemical Terminology (Gold Book), 5th online edition (2025), based on the IUPAC Recommendations 2019, published in Pure and Applied Chemistry in 2020. DOI: 10.1351/goldbook.09129. Official definition
[2] IUPAC. Chronopotentiometry. Compendium of Chemical Terminology (Gold Book), 5th online edition (2025), based on the IUPAC Recommendations 2019, published in Pure and Applied Chemistry in 2020. DOI: 10.1351/goldbook.09126. Official definition
[3] US Department of Energy. Hydrogen Production: Electrolysis. Official technical overview. Official overview
[4] US Department of Energy. Fuel Cells. Official technical overview. Official overview
[5] EG&G Technical Services, Inc. (2004). Fuel Cell Handbook, Seventh Edition. US Department of Energy, National Energy Technology Laboratory, November 2004. Chapter 2: thermodynamics, energy balance and efficiency. Handbook
[6] Malkow, T.; Pilenga, A.; Tsotridis, G.; De Marco, G. (2018). EU harmonised polarisation curve test method for low-temperature water electrolysis. European Commission JRC104045; EUR 29182 EN. DOI: 10.2760/179509. Official record
[7] Tsotridis, G.; Pilenga, A.; De Marco, G.; Malkow, T. (2015). EU harmonised test protocols for PEMFC MEA testing in single cell configuration for automotive applications. European Commission JRC99115; EUR 27632 EN. Repository release 2016. DOI: 10.2790/54653. Official record
[8] IEC (2025). IEC TS 62282-7-1:2025, Fuel cell technologies — Part 7-1: Test methods — Single cell performance tests for polymer electrolyte fuel cells (PEFC). Edition 3.0. Official catalogue
[9] Fortiner, S.; Ouimet, R.; Young, J. L.; Bender, G.; Carmo, M.; Ayers, K. (2025). A harmonized protocol to assess the single-cell performance of proton exchange membrane water electrolyzers. Frontiers in Energy Research 13, 1549219. DOI: 10.3389/fenrg.2025.1549219. Open-access article
[10] Lickert, T.; Fischer, S.; Young, J. L.; et al. (2023). Advances in benchmarking and round robin testing for PEM water electrolysis: Reference protocol and hardware. Applied Energy 352, 121898. DOI: 10.1016/j.apenergy.2023.121898. Publication
[11] Gerhardt, M. R.; Pant, L. M.; Bui, J. C.; Crothers, A. R.; Ehlinger, V. M.; Fornaciari, J. C.; Liu, J.; Weber, A. Z. (2021). Method—Practices and Pitfalls in Voltage Breakdown Analysis of Electrochemical Energy-Conversion Systems. Journal of The Electrochemical Society 168, 074503. DOI: 10.1149/1945-7111/abf061. Publication · Author-repository text
[12] Franzetti, I.; Pushkarev, A.; Chan, A.-L.; Smolinka, T. (2023). Parasitic Effects in Impedance Spectrum of PEM Water Electrolysis Cells: Case Study of High-Frequency Inductive Effects. Energy Technology 11, 2300375. DOI: 10.1002/ente.202300375. Publication · Author-laboratory text
[13] Fortin, P.; Gerhardt, M. R.; Ulleberg, Ø.; Zenith, F.; Holm, T. (2022). Multi-Sine EIS for Early Detection of PEMFC Failure Modes. Frontiers in Energy Research 10, 855985. DOI: 10.3389/fenrg.2022.855985. Open-access article
[14] Malkow, T.; Pilenga, A.; Tsotridis, G. (2018). EU harmonised test procedure: electrochemical impedance spectroscopy for water electrolysis cells. European Commission JRC107053; EUR 29267 EN. Repository release 2019. DOI: 10.2760/8984. Official record
[15] Schönleber, M.; Klotz, D.; Ivers-Tiffée, E. (2014). A Method for Improving the Robustness of linear Kramers–Kronig Validity Tests. Electrochimica Acta 131, 20–27. DOI: 10.1016/j.electacta.2014.01.034. See also the authors’ KIT Lin-KK methodological explanation. Publication · Authors’ Lin-KK explanation
[16] Kempler, P. A.; Nielander, A. C. (2023). Reliable reporting of Faradaic efficiencies for electrocatalysis research. Nature Communications 14, 1158. DOI: 10.1038/s41467-023-36880-8. Open-access article
[17] Joint Committee for Guides in Metrology (2012). International vocabulary of metrology—Basic and general concepts and associated terms (VIM), third edition. JCGM 200:2012. See accuracy, precision, reproducibility and measurement-uncertainty definitions. Official vocabulary
[18] US Department of Energy. Safe Use of Hydrogen. Official safety overview. Official overview
[19] Stanford Research Systems (2025). EC301 Potentiostat/Galvanostat User Manual, revision 1.3, 14 March 2025. Selected control, output-state, measurement-range and grounding sections. Configuration-specific documentation; not a universal connection method. Manufacturer manual
[20] Gamry Instruments. Framework help: Electrochemical Frequency Modulation setup parameters. DC Voltage and open-circuit-reference fields only. Cited for software reference terminology—not as a PEM procedure or a recommendation to use EFM. Official software documentation
[21] Prestat, M. (2023). Corrosion of structural components of proton exchange membrane water electrolyzer anodes: A review. Journal of Power Sources 556, 232469. DOI: 10.1016/j.jpowsour.2022.232469. Peer-reviewed materials assessment.
[22] Chemours. Teflon™ Fluoropolymers Product Selection Guide, electrical properties of PTFE (typical volume resistivity >10¹⁸ Ω cm). Manufacturer materials data; values are not a specification for a particular test-cell assembly. https://www.teflon.com/en/products/product-selection-guide
19. Get in touch
Contact the ScienceGears technical team to discuss your PEM experiment.