

1. Why "typical" operating conditions are a starting point, not a specification
You have a new membrane electrode assembly (MEA) in a cell, a heated water loop, and a power supply. Someone in your group says "run it at 80 °C, ambient pressure, and a decent flow". Three weeks later your polarisation curve sits 150 mV above a published one, and nobody can say whether the gap comes from the catalyst, the porous transport layer, or the way you ran the experiment.
The uncomfortable answer is that operating conditions are part of the result. Cell voltage in a PEM water electrolyser is the sum of the reversible voltage and several overpotentials, and the literature models it in exactly those terms: reversible voltage plus activation overpotential plus ohmic overpotential, with mass-transport terms added at higher current density. Every one of those terms moves with temperature, pressure, and water supply. If you change the conditions, you change the voltage, even with an identical MEA.
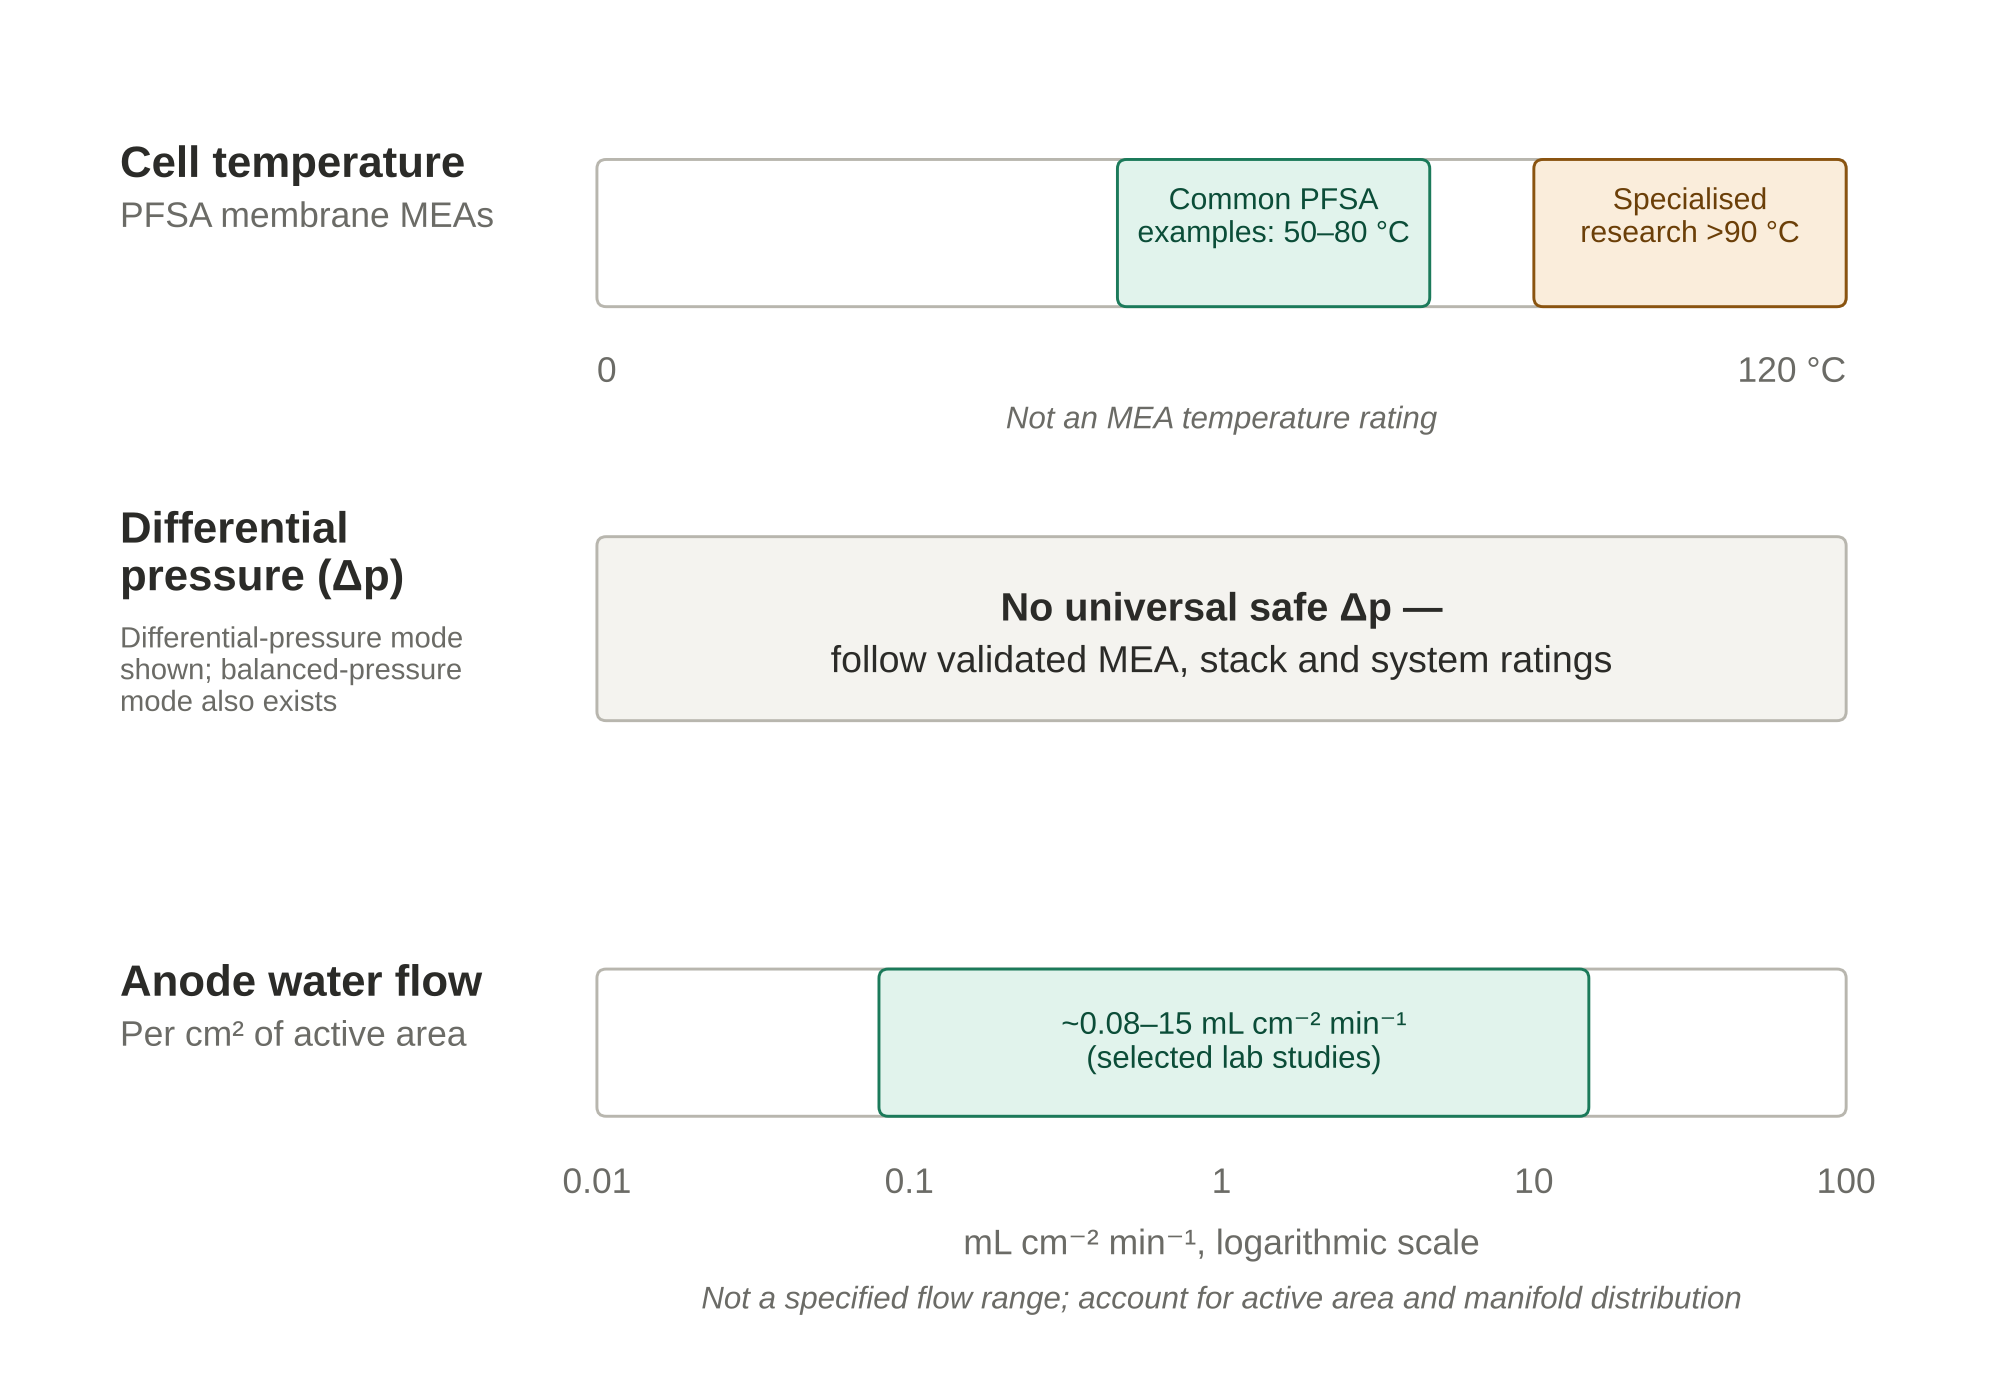
This guide separates what is broadly agreed from what is cell-specific. The broadly agreed part is short: cell temperatures commonly around 50–80 °C, anode-fed liquid-water operation, and circulation often substantially above reaction consumption. Pressures vary by system: differential-pressure designs may pressurise the cathode while leaving the anode near ambient, whereas balanced-pressure systems pressurise both sides; no generic pressure limit is a safe operating specification. The cell-specific part is everything else, and it is where good experimental design earns its keep.
Throughout, I distinguish three things: values taken from peer-reviewed literature, values I have derived from first principles so you can check the arithmetic, and bench practice that depends on your hardware. Where a figure is bench practice rather than a literature value, I say so.
Related reading: see the further reading section for existing ScienceGears guides on MEAs, porous transport layers, and test cell hardware.
2. The typical operating window at a glance
Before the detail, these are illustrative conditions reported for low-temperature PEM water electrolysis—not limits for a particular MEA, stack or test stand. Apply the manufacturer-approved temperature, absolute-pressure, differential-pressure, water-quality and gas-purity limits.
| Parameter | Typical range | Source or basis |
|---|---|---|
| Cell temperature | 50–80 °C | Conventional liquid-water PFSA systems; confirm the exact MEA and stack ratings |
| Cathode (hydrogen) pressure | Ambient to tens of bar in published systems; design-specific | Absolute-pressure rating and H₂-in-O₂ crossover safety must be verified |
| Anode (oxygen) pressure | Near ambient in differential mode; pressurised in balanced mode | O₂-enriched and pressurised systems require assessed oxygen compatibility, segregation and protection |
| Differential pressure | No universal safe Δp: use MEA/stack differential-pressure rating and protective interlocks | Membrane support, seals, transients and gas-purity safety determine usable Δp |
| Anode water supply | Anode liquid-water feed; examples span ~0.08–15 mL cm⁻² min⁻¹ in selected laboratory studies | Research examples only; verify reactant supply, water transport, gas removal, heat load and manifold distribution |
| Water quality | Deionised or otherwise OEM-specified high-purity water; check inlet quality and compatibility | Manufacturer guidance and bench practice |
| Current density | Often ~1–3 A cm⁻² for conventional systems; substantially higher values occur in specialised research | Report actual current density, active area, voltage, operating mode and component limits |
Two notes on this table. First, the range for temperature reflects commercial and mainstream research practice for perfluorosulfonic acid membranes. Elevated-temperature operation above 90 °C is an active research area rather than a standard condition, and I treat it as outside the main body of this guide. Second, "typical" current density varies enormously with application; research fixtures, teaching devices and industrial stacks need not share an operating range. Neither Figure 1 nor this table establishes a safe upper limit.
3. Temperature: what 50–80 °C buys you and what it costs
Raising temperature helps a PEM electrolyser in two ways at once. It increases the ionic conductivity of the hydrated membrane, which lowers ohmic loss, and it speeds up electrode kinetics, which lowers activation overpotential. A published single-cell model reported area-specific ohmic resistance falling from 0.198 to 0.125 Ω cm² between 40 and 80 °C, and an operating voltage at 2 A cm⁻² falling from 2.13 V to 1.98 V, a reduction of about 7 %. Treat those as simulation outputs for a particular membrane and cell model rather than numbers to reproduce, but the direction and rough size of the effect are consistent with experiment.
The thermodynamic floor
For splitting liquid water near 25 °C and standard conditions, the reversible voltage is approximately 1.23 V and the thermoneutral voltage is approximately 1.48 V. Both depend on conditions, particularly pressure and temperature. An operating voltage can lie between these values: above thermoneutral voltage the cell releases net reaction heat, whereas below it net external heat is required. At high current densities, the heat-removal duty is often substantial, but complete stack thermal balance must also include water heating, evaporation, gas outlets and environmental heat exchange. We return to this quantitatively in the worked examples.
The durability trade-off
The performance case for going hotter is real, so why not run at 90 °C or above? Because degradation accelerates. In a constant-current durability study across 50–80 °C, the degradation rate increased with operating temperature. At 50–65 °C, loss of iridium oxide catalyst performance dominated the decay, whereas at 80 °C the membrane and electrode degraded at similar rates, and in that experiment a short circuit through the membrane developed and performance fell to roughly a third of its initial value within 144 hours. That result depends on the membrane thickness and the specific MEA, and I would not quote 144 hours as a general lifetime. This is a specific experiment, not a predicted membrane lifetime. The transferable lesson is that temperature-dependent performance gains must be weighed against MEA-dependent chemical and mechanical degradation.
Review literature on elevated-temperature operation (90–170 °C) argues for lower cell voltage, reduced catalyst loading, and better waste-heat use, but also stresses that cell components and system-level materials need reassessing. For a new conventional PFSA research MEA, 80 °C is a useful reference point only if the exact membrane, seals and cell are rated for it; it is not a universal upper bound.
Temperature affects more than voltage
Three secondary effects catch people out.
Gas volume in the anode channel. Neutron imaging and optical studies of operating PEM electrolysers found that higher temperature produced less liquid water and more gas volume in the anode chamber. If a high-current voltage penalty appears after raising temperature, a change in two-phase flow may contribute; separate it from membrane hydration, thermal gradients and contact resistance before assigning a cause.
Water transport to the cathode. The same studies observed enhanced water transport into the cathode chamber at higher temperature, and the water that crosses the membrane can limit hydrogen mass transport at the cathode.
Crossover. Hydrogen permeation through the membrane depends on temperature as well as on pressure, thickness, and water uptake. The next section covers this, but note now that a temperature increase is never free of consequence for gas purity.
Practical temperature advice for the bench
- Report the temperature you measured, and say where you measured it. A thermocouple in the water inlet, one embedded in the end plate, and one in the outlet can disagree by several degrees at high current. State which one controls your loop.
- Allow thermal equilibrium before recording a curve. In one set of published single-cell experiments, each test began with a start-up phase in which the cell gradually reached the set temperature before data were taken. Copy that discipline.
- Compare temperatures at matched conditions. If you record 60 °C and 80 °C curves, hold pressure, flow rate, and conditioning history identical.
- If permitted by the exact MEA and test-stand manuals, 60 °C may be a useful first research setpoint; advance temperature only after a stable baseline and a documented safety review. This is bench practice, not a universal conditioning or protection procedure.
4. Pressure: differential, balanced, and why the anode usually stays near ambient
Hydrogen is stored and distributed under pressure, so there is a strong incentive to produce it pressurised. The question is how.
Differential-pressure operation
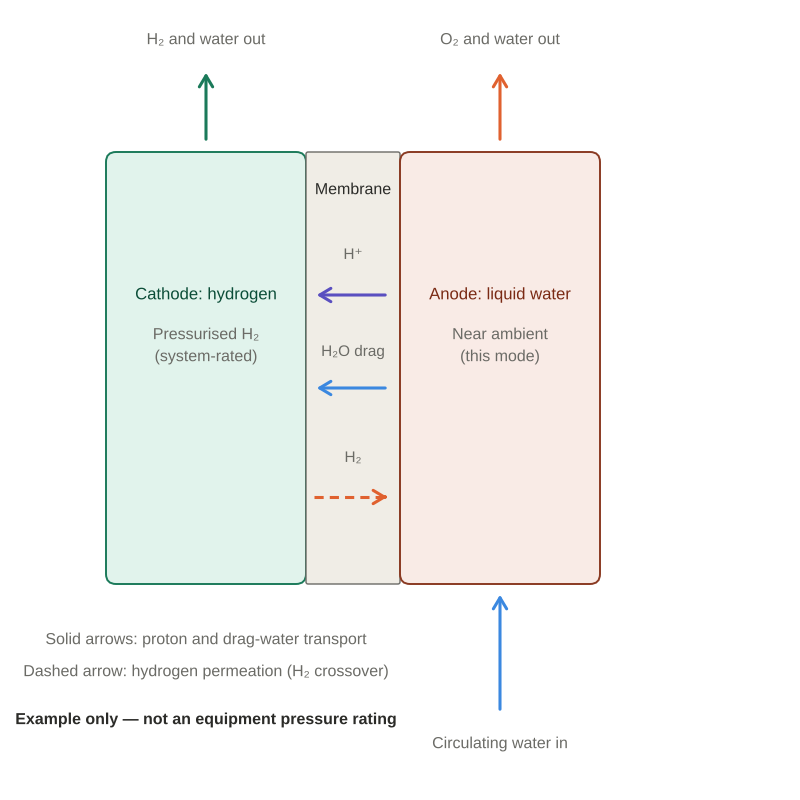
In differential-pressure operation, the hydrogen cathode is maintained above an anode that may be near ambient. Producing pressurised H₂ can reduce downstream mechanical compression, but its net energy and safety benefits depend on cell voltage, balance-of-plant design, crossover and the delivery-pressure requirement. Published systems include pressures in the tens of bar; 30 bar is an example, not a universal industrial setpoint or allowable MEA differential.
Why keep the anode near ambient in a differential-pressure design? It simplifies some liquid-water circulation and oxygen-handling arrangements, but it does not eliminate the hazard from oxygen-rich gas or crossover. Oxygen can also be pressurised intentionally in qualified balanced-pressure systems. Oxygen-service compatibility, gas separation, vent routing, pressure protection and monitoring are needed according to the assessed design; there is no universal 10 bar safety threshold.
The price is mechanical and chemical stress on the membrane. A pressure difference imposes mechanical stress and may contribute to membrane deformation or failure at pressures below or above 30 bar, depending on membrane thickness, reinforcement, temperature, support geometry and transients. Thinner membranes can reduce ohmic resistance while increasing crossover and reducing mechanical margin. Operate only within the validated pressure and differential-pressure ratings of the complete assembly.
Balanced-pressure operation
In balanced mode, water is pressurised so that anode and cathode sit at similar pressure. This reduces the transmembrane pressure difference, but does not remove all mechanical stresses or the oxygen-side pressure hazard. Both gas circuits require suitable pressure-rated equipment and protective controls. It is not free either. In an X-ray imaging study of a cell operated in balanced mode up to 30 bar, the flow regime in the anode channel changed from bubbly to slug flow as pressure rose, and the two-phase flow distribution changed. The authors concluded that the efficiency penalty of balanced operation is hard to explain by hydrogen crossover alone, which points toward two-phase flow as a contributing factor. Pressure therefore changes your water management problem, and I return to this in the flow-rate section.
Hydrogen crossover and why it limits your safe window
Hydrogen permeates from the cathode through the membrane to the anode, where it mixes with oxygen. This can reduce useful hydrogen yield and, at sufficient H₂-in-O₂ concentration, create an ignition or explosion hazard. At low current density or during transients the oxygen generation rate may be low relative to crossover, so gas concentration can become especially important even when the permeation flux is modest. Crossover depends on membrane thickness, water uptake, and permeability, and on operating conditions including temperature, differential pressure, and current density.
Several results from the literature are worth knowing:
- Permeation scales with hydrogen partial pressure at zero current. Permeation-cell measurements without applied current showed a linear correlation between permeation rate and hydrogen partial pressure, which indicates diffusion as the main crossover mechanism.
- Current density changes the picture. In operating MEAs, the gas permeation rate rose substantially at high current density. The increase reached about twentyfold at 1 bar hydrogen but only about 1.2-fold at 30 bar hydrogen, in tests on Nafion 212 and 117 membranes covering 0–6 A cm⁻² and 1–30 bar differential pressure. In other words, at low pressure the current-driven enhancement is a large relative effect, whereas at high pressure the pressure-driven diffusive flux already dominates.
- Some permeated hydrogen is oxidised at the anode. Work on differential-pressure cells at 10–30 barg showed that a hydrogen oxidation current appears under differential pressure, is diffusion-limited, and consumes a significant fraction of the permeated hydrogen. Ignoring it leads to a severe underestimate of the true crossover rate. If you quantify crossover from anode-side gas analysis alone in a differential-pressure experiment, you may be undercounting.
- Electro-osmotic drag works against crossover. Water dragged with protons from anode to cathode carries dissolved hydrogen the opposite way to diffusion. A study of thin Nafion 212 cells at up to 10 A cm⁻² and cathode pressures up to 10 bar concluded that this drag attenuates net hydrogen crossover as current density rises, which is one reason crossover fractions behave differently at low and high current.
- Catalytic recombination is one investigated mitigation approach, including carefully engineered catalyst-containing MEAs or qualified downstream gas treatment. It is not a stand-alone safety control. Validated membrane selection, operating limits, H₂-in-O₂ analysis, independent alarms/interlocks and appropriate venting remain necessary.
Practical pressure advice for the bench
- Where the manufacturer permits ambient-pressure operation, establish a baseline polarisation curve, high-frequency resistance and conditioning history before pressure studies. Do not use an ambient baseline as a substitute for the required pressure-system safety qualification.
- Before introducing hydrogen, complete the manufacturer- and institution-approved pressure-integrity and leak-test procedure using the specified safe test medium, instrumentation and pressure limits. Pressurisation, purge and shutdown sequences must be approved for the complete system; do not improvise a hydrogen leak test as the first pressurisation.
- Match your anode gas handling to the hazard. For gas-generating operation, specify suitable H₂-in-O₂ process monitoring, gas separation, ventilation/vent routing and automatic protective actions before testing, especially at elevated cathode pressure and low load. Alarm and shutdown setpoints require the approved risk assessment and safety design; a commonly reported 2 vol% H₂-in-O₂ shutdown convention is not a blanket licence to operate below that value.
- Check the hardware rating against the pressure you plan. Verify absolute and differential-pressure ratings, temperature limits, oxygen compatibility, relief devices, seals, tubing and fittings as one engineered system. The lowest applicable component rating and the approved pressure test govern operation; do not infer a pressure rating from a catalogue photograph.
- Know your membrane. For differential-pressure studies, assess membrane thickness, reinforcement, support and gas permeability against the exact operating envelope; a thicker membrane may lower crossover but is not by itself proof of safe pressure capability.
5. Anode water flow rate: three jobs, one pump
If temperature and pressure are the parameters people argue about, anode water flow is the one people guess. It deserves better, because the pump setting changes performance, temperature uniformity, and lifetime.
The flow of liquid water through the anode does three distinct jobs.
It supplies the reactant. Water is oxidised at the anode catalyst layer. The consumption is small and set by Faraday's law, as the next section shows.
It hydrates the membrane. In conventional anode-fed liquid-water PEM electrolysis, membrane hydration relies on appropriate water activity and supply rather than an arbitrary high pump rate, and the membrane must remain hydrated to conduct protons. Water also travels through the membrane to the cathode by electro-osmotic drag and diffusion, which means the anode must keep supplying more than the reaction consumes.
It removes oxygen and heat. Oxygen bubbles must leave the porous transport layer and flow field, and the heat generated above thermoneutral voltage must be carried out of the stack. Depending on the cell and its operating point, reactant/water-transport requirements, oxygen removal, heat rejection and distribution collectively set the flow requirement.
Water stoichiometry
Researchers describe the circulation rate through the water stoichiometry, defined as the ratio of circulated water to the water consumed by electrolysis at a given current density. One study introduced a design- and operating-point-dependent critical water-supply ratio for stable performance, and examined how performance behaved below it under water starvation. The central message is that there is a threshold below which performance degrades because water supply no longer keeps the membrane hydrated and the oxygen cleared, and that the threshold depends on current density and flow-field design.
Notice what this implies for your protocol. If flow is held constant while current rises, stoichiometry falls, and you can cross the threshold part-way through a polarisation curve without changing any setting. A curve that bends sharply at high current density may be telling you about your pump, not your catalyst.
Bubbles and flow regimes
High-speed optical studies of anode flow fields show two characteristic patterns: periodic growth and removal of small bubbles, and prolonged blockage by large stagnant bubbles. Bubble distribution across the active area is not uniform, because of buoyancy and the proximity of each region to the inlet. The effect of flow rate on performance was found to depend strongly on temperature, and longer channels were found to promote gas accumulation and channel blocking, which degrades performance.
A related set of results supports a moderate approach to flow rate. A control study found that a moderate increase in water flow rate removed accumulated bubbles under fluctuating power input and improved system efficiency, but it also accounted for the energy consumed by the auxiliary pump. Another thesis-level study compared three gas management strategies: changing the cell's orientation relative to gravity, increasing water flow rate, and testing surfactants in a controlled research study. Do not add surfactants to a commercial MEA water loop without validated chemical compatibility and approval. Orienting the channels to assist bubble departure improved performance, which is a free variable many labs forget they have.
The takeaway is that "more flow is better" is wrong beyond a point. Extra flow increases pump power, can increase pressure drop across the stack, and, in a stack, can maldistribute between cells. There is an optimum, and it moves with current, temperature, and flow-field geometry.
Flow rate in the literature
Raw mL min⁻¹ figures need the active area, number of parallel-fed cells, current density, water inlet temperature and flow-field arrangement before comparison. Published values, converted to millilitres per cm² of active area per minute, span a wide range:
- 0.08 mL cm⁻² min⁻¹. In a 5 cm² cell at 80 °C, this rate was reported as sufficient to cover water consumed at the anode plus water lost by diffusion and electro-osmotic drag. Treat it as a floor for that cell, not a recommendation.
- About 0.8 mL cm⁻² min⁻¹. A cited 25 cm² Nafion 117 test at 20 mL min⁻¹ reported 1.5 A cm⁻² at 2.4 V with water supplied to both anode and cathode; it is not a direct anode-only-feed benchmark.
- About 1.8–3.4 mL cm⁻² min⁻¹. In one 9 cm² atmospheric-pressure study, 16.5–30.6 mL min⁻¹ was examined; temperature and voltage had much larger effects on performance than water flow across the tested conditions.
- About 7.5–15.1 mL cm⁻² min⁻¹. Selamet and co-workers reported 0.75–1.51 L min⁻¹ for a 100 cm² PEM electrolyser configuration, with little measured performance sensitivity to this flow variation at ambient temperature. This result is specific to their setup and is not a transferable flow recommendation.
More flow is not automatically better. At a fixed inlet temperature, lower flow may allow the cell to run hotter and show a smaller apparent ohmic loss, even while reducing cooling margin. Conversely, greater flow can assist gas removal but also increases pump energy and pressure drop. Compare actual cell temperature and flow-field conditions before attributing a voltage difference to bubble effects. Bubble removal and heat balance pull the optimum in different directions, and it moves with current density, temperature, and flow-field geometry.
For scale in a different context, a transparent-cell study varied flow between 100 and 300 mL min⁻¹ and found that a 0.5 T magnetic field at 300 mL min⁻¹ improved performance by 33 % over conventional operation at the same flow. A magnetic field cannot change how much water the reaction consumes, which the authors associated with improved bubble removal under that specific transparent-cell configuration; it is not a general flow-rate or magnetic-field recommendation.
Water quality
PEM electrolysers use deionised water. Impurities, particularly metal cations, can poison catalysts and degrade the membrane. Use the OEM-specified feed-water purity, conductivity/resistivity and allowable ionic/organic contaminants; deionised and distilled water are not interchangeable universal specifications. Record inlet quality and relevant trends, and use compatible polishing, filtration or recirculation only as specified for the equipment.
6. Sizing the flow: worked examples from current to litres per minute
This section is deliberately arithmetic. Everything here follows from Faraday's law and the heat balance, so you can adapt it to your own cell.
Step 1: water consumed by the reaction
Each mole of water consumed requires two moles of electrons. Per cell:
- Moles of water per second = I / (2F), where F = 96,485 C mol⁻¹.
- For 1 A: 1 / (2 × 96,485) = 5.18 × 10⁻⁶ mol s⁻¹.
- Multiply by 18 g mol⁻¹ and by 60 s min⁻¹: about 0.0056 g min⁻¹ per ampere per cell.
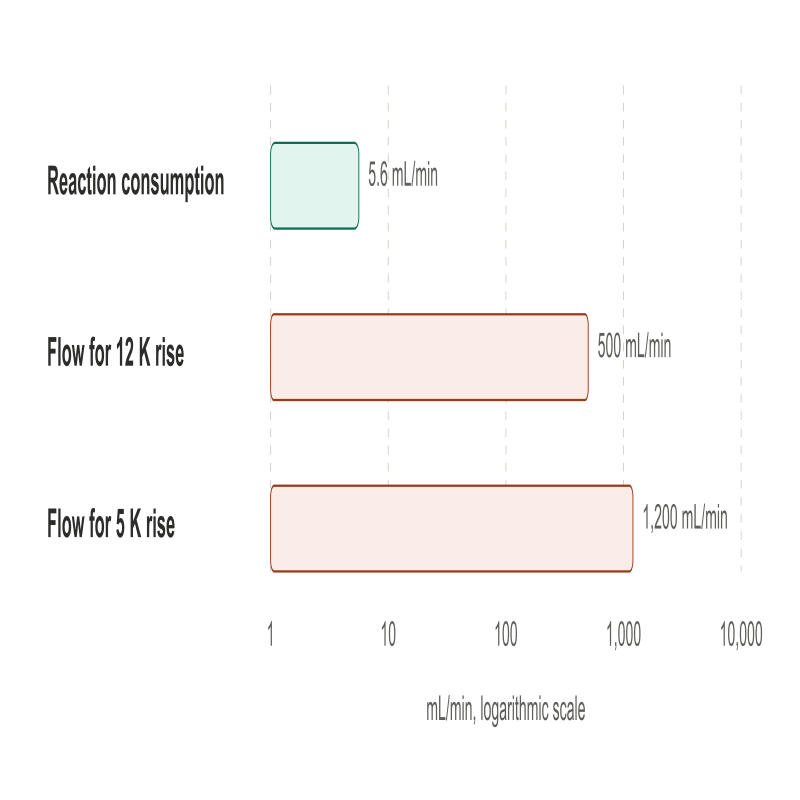
For a 10-cell stack at 100 A, the reaction consumes roughly 10 × 100 × 0.0056 ≈ 5.6 g min⁻¹, or about 5.6 mL min⁻¹. For a 10-cell series stack, each cell carries 100 A; thus 5.6 mL min⁻¹ is the total reaction consumption across all ten cells (liquid-water density approximated as 1 g mL⁻¹). The higher circulating flow in many systems reflects transport, gas removal and thermal requirements; actual flow is design dependent.
Step 2: hydrogen produced
Hydrogen is produced at the same molar rate as water is consumed. At 100 % Faradaic efficiency, 1 A produces 5.18 × 10⁻⁶ mol s⁻¹ of hydrogen, which is about 7 mL min⁻¹ at 0 °C and 1 atm. A 5 cm² single cell at 1 A cm⁻² carries 5 A and so produces about 35 mL min⁻¹ of hydrogen on that basis. For the 10-cell, 100 A series stack the ideal dry-gas outputs would be about 7.0 L min⁻¹ of H₂ and 3.5 L min⁻¹ of O₂ at 0 °C and 1 atm, before accounting for crossover, Faradaic efficiency, water vapour, pressure and temperature. Size each gas-side analyser, separator and vent using its own flow and the approved safety design.
Step 3: heat load and the flow that removes it
For this simplified steady-state liquid-water example, the approximate net reaction heat at each cell is (V − 1.48 V) × I, using 1.48 V as the assumed thermoneutral voltage. This is not the total installed cooling duty. For a 10-cell stack at 100 A and 1.9 V per cell:
- Heat ≈ 10 × (1.9 − 1.48) × 100 = 420 W.
- Water has a specific heat of about 4.18 J g⁻¹ K⁻¹. Approximating the circulating water density as 1 g mL⁻¹, a flow of 0.5 L min⁻¹ is about 8.3 g s⁻¹, which carries 8.3 × 4.18 ≈ 35 W K⁻¹.
- Temperature rise across the stack ≈ 420 / 35 ≈ 12 K.
This is an idealised, all-heat-to-liquid calculation. A real design also includes heat loss/gain through the stack, inlet-water heating, sensible/latent enthalpy in product streams, cooling-loop hardware and the required control margin. If you want the water temperature to rise by no more than about 5 K across the stack, you need roughly 1.2 L min⁻¹ for this example, and that figure is set by heat, with water consumption irrelevant. Many users pick a flow for bubble removal and discover afterwards that their stack runs hot at high current. Do both calculations, and take the larger.
Step 4: stoichiometry check
For the same stack, consumption was about 5.6 mL min⁻¹. A circulation rate of 0.5 L min⁻¹ is a water stoichiometry of about 90, and 1.2 L min⁻¹ is about 210. These ratios compare total manifold feed with total stack consumption for a parallel-fed 10-cell stack; they do not establish whether every cell receives sufficient flow. Low-flow starvation can occur in any cell or stack when local supply and water transport are inadequate.
Cross-check against published flows. If each cell in this example has a 100 cm² active area, the 10-cell stack has 1,000 cm² in total, so 500 mL min⁻¹ is 0.5 mL cm⁻² min⁻¹ and 1,200 mL min⁻¹ is 1.2 mL cm⁻² min⁻¹. This normalisation assumes that all ten 100 cm² cells receive parallel feed from a common manifold and that the stated 500 or 1,200 mL min⁻¹ is total flow distributed across them. It is not equivalent to dividing the full stack flow by only one cell’s active area. At 1 A cm⁻² the reaction itself consumes only about 0.0056 mL cm⁻² min⁻¹, so the 0.08 mL cm⁻² min⁻¹ floor quoted above is about 14 times the reaction demand. That is plausible, because electro-osmotic drag in Nafion has been reported at on the order of a few water molecules per proton under some hydration conditions, and each water molecule consumed releases two protons.
Step 5: pressure drop and distribution
For a stack, the flow is divided among cells through a manifold, and each cell receives a fraction determined by its hydraulic resistance. Total flow that looks adequate on paper can still starve the cell furthest from the inlet. A single cell voltage drifting higher at high current can indicate maldistribution, contamination, membrane damage or contact issues; first compare individual cell flows, temperatures and voltages, and check the stack's pressure drop against the supplier's specification.
A starting protocol for a single cell (bench practice)
This illustrative baseline is not a universal start-up or commissioning procedure. Use it only after the OEM operating instructions and site-approved hydrogen, oxygen, electrical, thermal and water-system controls have been satisfied:
- Fill and prime the anode circuit with OEM-specified high-purity water using the validated purge, venting and conditioning sequence; verify gas separation and avoid trapped gas. Any open-circuit wetting duration is device-specific.
- If rated for 60 °C, bring the cell to the chosen setpoint under controlled conditions and confirm the actual cell temperature is stable.
- Select a flow meeting the manufacturer’s minimum and maximum limits, reaction and membrane-water demand, oxygen removal, temperature rise and allowable pressure drop at the highest planned current.
- After all gas-monitoring and protective interlocks are active, follow the approved current-ramp and hold protocol, documenting each current step and its stabilisation criterion.
- Record cell voltage, current and current density, high-frequency resistance, actual cell and inlet/outlet temperatures, anode water flow, both pressures, gas composition and protective-control status where applicable.
7. Setting up a reproducible test: ramp, conditioning, and reporting
Good operating conditions are wasted if the protocol that applies them is not reproducible. This section covers what I would want to see in the methods section of a paper.
Conditioning
A new MEA does not deliver its steady performance immediately. Wetting, catalyst-layer activation, and interface settling occur over the first hours of operation. Condition the MEA using a procedure validated for its membrane, catalyst and cell design, and define a reproducible voltage/HFR stability criterion before polarisation measurements. Report conditioning temperature, pressure, water quality, flow, current/voltage history and rest intervals.
Porous transport layer condition
The anode porous transport layer (PTL) is usually titanium, and titanium forms a passivating oxide under anodic conditions. This raises interfacial resistance. Published studies have shown that a thin iridium coating on a commercial titanium PTL reduced contact resistance by 70 mΩ cm² and improved cell performance, and that research-scale acid treatment combined with surface-hydride formation can reduce ohmic resistance; this is a specialised materials treatment, not a general laboratory cleaning instruction. If voltage increases during a long hold, PTL passivation is one possible contributor among membrane changes, catalyst degradation, contact resistance and water/gas-management effects. Identify the mechanism with matched electrochemical and post-test evidence rather than treating voltage drift alone as proof. Adding a microporous layer between the catalyst layer and the PTL has also been shown to cut interfacial contact resistance, and in the cathode case one study reported a reduction of about 60 % at 400 N cm⁻².
Compression and cell assembly
Cell compression changes contact resistance and mass transport. Apply only the specified stack assembly/compression procedure; record the required clamping load or torque, gasket type, compression reference and tightening sequence. An arbitrary torque value cannot be transferred between fixtures. If you compare two MEAs, assemble both the same way.
Reporting checklist
Report the following with every polarisation curve:
- Cell temperature, and the location of the measurement.
- Cathode and anode absolute/gauge pressures separately (state which), the differential and relevant pressure transients.
- Anode feed/recirculation flow rate, measurement location, cell manifold arrangement and corresponding water stoichiometry at each current density.
- Inlet water quality (conductivity/resistivity, temperature and sampling location) and changes during the run as relevant.
- Membrane type and thickness, catalyst loadings, PTL material and thickness, compression.
- Conditioning protocol and history.
- Scan direction and hold time at each current step.
- Whether voltage is raw or iR-corrected, the measurement/compensation method, and how high-frequency resistance was obtained. Include gas-analysis method, analyser calibration, purge/vent and safety limits for pressure studies.
If someone cannot reproduce your result from this list, the protocol is incomplete.
8. Decision matrix: choosing conditions and hardware by application
The matrix below maps common research situations to a recommended starting regime. The linked ScienceGears pages describe relevant categories or test fixtures, not automatic approval for any pressure, PEMWE chemistry or temperature. Confirm model-specific specifications, materials, gas segregation and pressure limits in the actual quotation and manufacturer documentation.
| Application | Recommended regime | Specific product | Key rationale | Key constraint |
|---|---|---|---|---|
| New MEA baseline characterisation | If qualified: ~60 °C, near ambient, OEM-approved anode flow | MEA test-cell hardware (verify configuration) | Isolates MEA behaviour from pressure and flow effects | Needs reliable temperature control at the cell |
| Catalyst screening (anode iridium-based) | Within approved temperature range, near ambient; controlled flow and current density | MEA test-cell configuration enquiry | Matches mainstream literature conditions for comparison | Keep loading and flow identical across samples |
| Membrane thickness comparison | At an approved temperature, ambient baseline; elevated pressure only in an authorised test stand | Ion-exchange membranes (verify grade) | Compare area-specific resistance, H₂ crossover and supported pressure capability | Crossover measurement needs gas analysis |
| PTL and coating studies | Approved temperature, near ambient; controlled durability holds | Anode titanium PTL selection enquiry | Passivation shows up over hours, not minutes | Report PTL history and etching or coating |
| Microporous layer evaluation | Qualified high-current study at approved temperature; cathode MPL only if compatible | Cathode MPL / transport-media enquiry | MPL wettability and location affect contact, water management and crossover | Do not use carbon paper as a conventional PEMWE oxygen-anode PTL; record compression |
| Bubble and flow-field visualisation | Within validated optical-cell limits; vary and report water flow | Visual MEA test cell (verify application) | Lower temperature gives cleaner optical access | Do not infer a window pressure rating; obtain OEM documentation |
| Differential-pressure crossover studies | Approved temperature; cathode pressure stepped only within certified system/MEA limits | Pressure-rated configuration enquiry | Pressure, membrane, current density and low-load gas dilution all affect crossover hazard | Requires qualified system, gas analysis, interlocks, inert-gas pressure testing and safe venting |
| Balanced-pressure studies | Only in an approved balanced-pressure system; pressure limits verified | Pressure-rated configuration enquiry | Reduces Δp; does not remove oxygen-side pressure or other stresses | Both gas sides need pressure protection, oxygen-compatible materials and gas monitoring |
| Short-stack durability test | Approved temperature/pressure; flow meets cooling and per-cell distribution | Stackable MEA cell hardware (verify design) | Thermal balance and cell-to-cell flow determine operating margin | Cell-to-cell voltage logging required |
| Bipolar plate and flow-field comparison | Matched approved temperature, current density, flow distribution and compression | Metal flow-field MEA cell (verify materials) | Channel length affects gas accumulation | Compare at equal active area and compression |
| Water quality and contamination studies | Dedicated, institution-approved contamination study at rated conditions | Water-loop integration enquiry | Isolates contaminant effect | Use approved chemicals/waste disposal; monitor inlet chemistry and cell condition |
| Teaching and demonstration | Device-approved low-temperature, low-power demonstration only | Educational configuration enquiry | Lower thermal load does not eliminate hydrogen or oxygen hazards | Use OEM water specification, gas separation, ventilation and supervision |
9. Frequently asked questions
What is the typical operating temperature of a PEM electrolyser?
Most PEM water electrolysers operate at cell temperatures between 50 and 80 °C. Review literature on elevated-temperature operation describes this as the current restriction, with 90–170 °C being an active research area. For a conventional research MEA rated for these conditions, 60 °C can be a starting point and 80 °C a subsequent study temperature after stable operation; never exceed the component-specific temperature and safety limits.
What pressure does a PEM electrolyser operate at?
It depends on the mode. In differential-pressure operation, the H₂ cathode is maintained above the O₂ anode pressure; an anode near ambient and cathode in the tens-of-bar range are reported configurations, not universal specifications. In balanced-pressure operation, both sides are pressurised. Many research cells are operated near ambient pressure, subject to their approved design. Safe pressurised operation requires complete hardware qualification, gas analysis and protective controls.
How fast should the anode water flow?
There is no single value, and a raw mL min⁻¹ figure only means something with the active area. Selected published laboratory examples span approximately 0.08–15 mL cm⁻² min⁻¹, but this is not a design or safety range. The flow must exceed the water consumed by a large factor, and it is usually set by bubble removal and heat removal rather than by reactant supply. Calculate your own from the current, the heat load, and the stoichiometry; section 6 shows how.
What is water stoichiometry in a PEM electrolyser?
It is the ratio of circulated water to the water consumed by the reaction at a given current density. A minimum stable feed ratio may be observed for a particular cell, current density and flow design; there is no universal critical value. If flow is fixed while current rises, stoichiometry falls and you can cross the threshold during a single polarisation curve.
Why does hydrogen cross over, and is it dangerous?
Hydrogen dissolves in and diffuses through the hydrated membrane towards the anode, driven by its partial pressure difference. At the anode it mixes with oxygen, and sufficient concentration creates a flammability risk. Risk controls include MEA and stack pressure qualification, membrane selection, H₂-in-O₂ process analysis, approved alarm/shutdown interlocks, gas separation and safe venting. Recombination catalysts may be an additional design measure, not a substitute.
Does running hotter always improve efficiency?
Not over the life of the cell. Higher temperature lowers ohmic and activation losses in the short term, but studies show faster degradation, and at the top of the range both the membrane and the electrodes degrade. The appropriate temperature balances voltage performance, membrane/catalyst durability, heat rejection and the exact OEM operating limits.
10. Expert support how ScienceGears works alongside your research
ScienceGears is run by electrochemists with PhD-level training and direct experience of setting up, running, and troubleshooting electrolysis cells. Our team can help researchers interpret operating-condition effects while recognising the limits of what a polarisation curve alone can establish.
Pre-purchase protocol review
If you are choosing a cell, an MEA, or a PTL for a particular temperature, pressure, and flow regime, send us your intended conditions before ordering. We can discuss component-compatibility questions and request the applicable OEM ratings; final operating approval, mechanical design and laboratory safety sign-off remain with the equipment owner and qualified personnel. Talk to our technical team →
Polarisation curve diagnosis
If your curve does not look like the literature, send us the data and your conditions. We can discuss possible ohmic, kinetic, thermal and transport contributions and identify measurements that could distinguish them; an unambiguous mechanism cannot be inferred from a curve alone.
Research hardware and configuration enquiries
- MEA test-cell hardware
- PEMWE MEA configuration advice
- Anode PTL selection advice
- Cathode MPL / carbon media selection advice
- Ion-exchange membranes
- Metal-plate MEA test hardware
- Pressure-rated configuration enquiry
- Stackable MEA cell hardware
"A good electrolyser result is a good set of operating conditions that someone else can reproduce; temperature, pressure, and flow are part of the data, not the background." — ScienceGears Technical Team
11. Further reading and sources
Selected peer-reviewed sources and safety standard (accessed 5 November 2026):
- Bonanno et al., “Review and Prospects of PEM Water Electrolysis at Elevated Temperature Operation”, Advanced Materials Technologies (2024). https://doi.org/10.1002/admt.202300281
- Alkhaldi et al., “Parametric study of PEM water electrolyzer performance”, Journal of Applied Electrochemistry (2025). https://doi.org/10.1007/s10800-024-02187-9
- Selamet et al., “Effects of operating parameters on the performance of a high-pressure proton exchange membrane electrolyzer”, International Journal of Energy Research (2013). https://doi.org/10.1002/er.2942
- Bernt et al., “Analysis of Gas Permeation Phenomena in a PEM Water Electrolyzer Operated at High Pressure and High Current Density”, Journal of The Electrochemical Society (2020). https://doi.org/10.1149/1945-7111/abaa68
- Fahr et al., “Overview and evaluation of crossover phenomena and mitigation measures in proton exchange membrane (PEM) electrolysis”, International Journal of Hydrogen Energy (2024). https://doi.org/10.1016/j.ijhydene.2024.04.248
- Gawas et al., “Importance of hydrogen oxidation reaction current in quantifying hydrogen crossover in PEM water electrolyzers at high differential pressure”, Energy & Environmental Science (2025). https://doi.org/10.1039/D5EE00048C
- Liu et al., “Performance enhancement of PEM electrolyzers through iridium-coated titanium porous transport layers”, Electrochemistry Communications (2018). https://doi.org/10.1016/j.elecom.2018.10.021
- Chen et al., “Key Components and Design Strategy for a Proton Exchange Membrane Water Electrolyzer”, Small Structures (2023). https://doi.org/10.1002/sstr.202200130
- Kaya et al., “Improving PEM water electrolyser’s performance by magnetic field application”, Applied Energy (2020). https://doi.org/10.1016/j.apenergy.2020.114721
- Yang et al., “Hydrogen cross-over monitoring in water electrolysis: A review of sensing technologies and a long-term field-stability study”, International Journal of Hydrogen Energy (2026). https://doi.org/10.1016/j.ijhydene.2026.157835
- ISO 22734-1:2025, Hydrogen generators using water electrolysis — Part 1: Safety (scope and status verified; consult the licensed standard and site requirements). https://www.iso.org/standard/82766.html
- ScienceGears related reading: What is a Membrane Electrode Assembly? https://www.sciencegears.com.au/blogs/what-is-mea-membrane-electrode-assembly-complete-guide
- Membrane selection for fuel cells, electrolysers and H-cells.
- Flow electrochemistry accessories: pumps, tubing, reservoirs and gas handling for MEA and flow cells.
ScienceGears MEA test-cell category (configuration-specific enquiry). https://www.sciencegears.com.au/membrane-electrode-assembly-mea-test-cells
Get in touch
If you are planning an electrolysis experiment and want a second pair of eyes on the conditions, contact our technical team to discuss compatible research hardware and request a model-specific quotation.